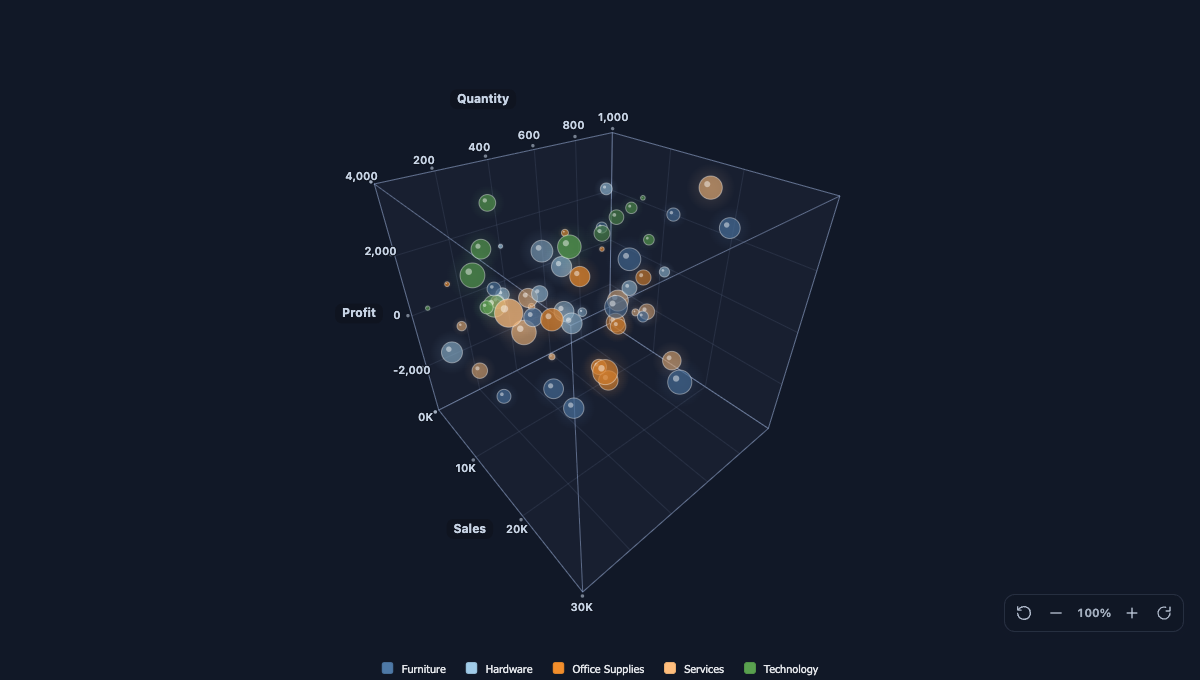
3D Scatter Plot
See three measures at once. The 3D Scatter Plot places your points in a real 3D axis box that you rotate and zoom inside your dashboard, with color and shape by category and an optional size measure.
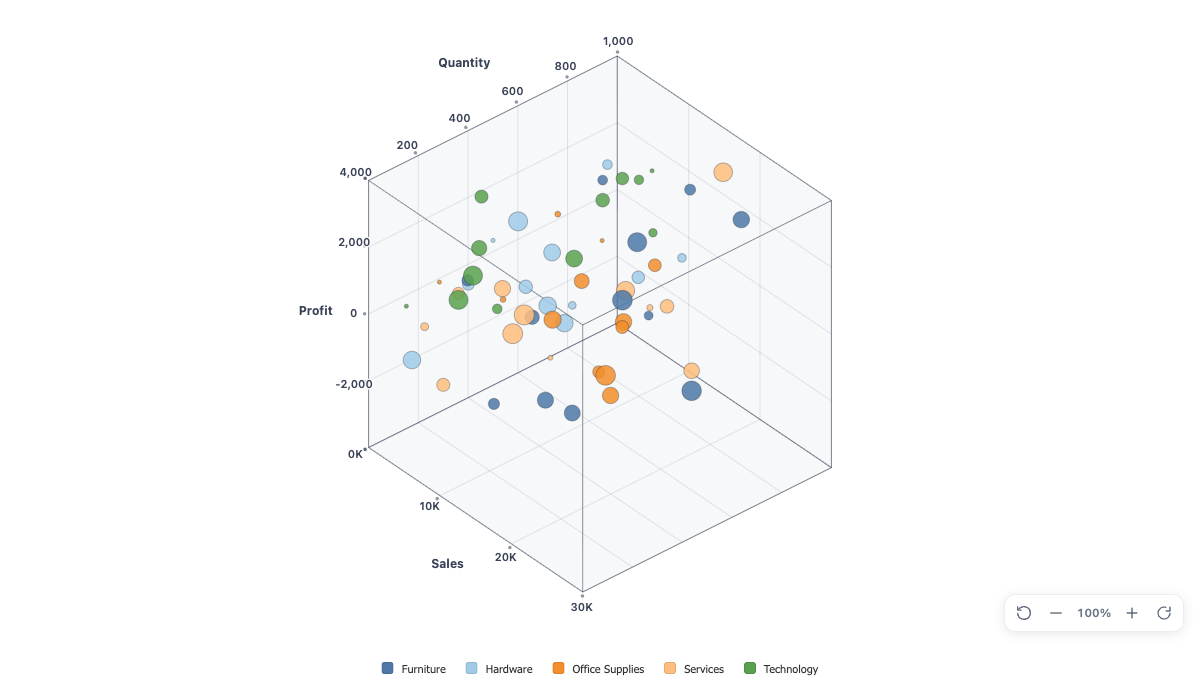
Three measures, one picture
Drag measures to X, Y, and Z, and the axis box renders and scales on its own, with round-value ticks and smart K, M, and B units on every axis. Add a fourth measure to Size, and a dimension on the Detail shelf to color the points by category. With only two measures in play, it renders a classic 2D scatterplot automatically.
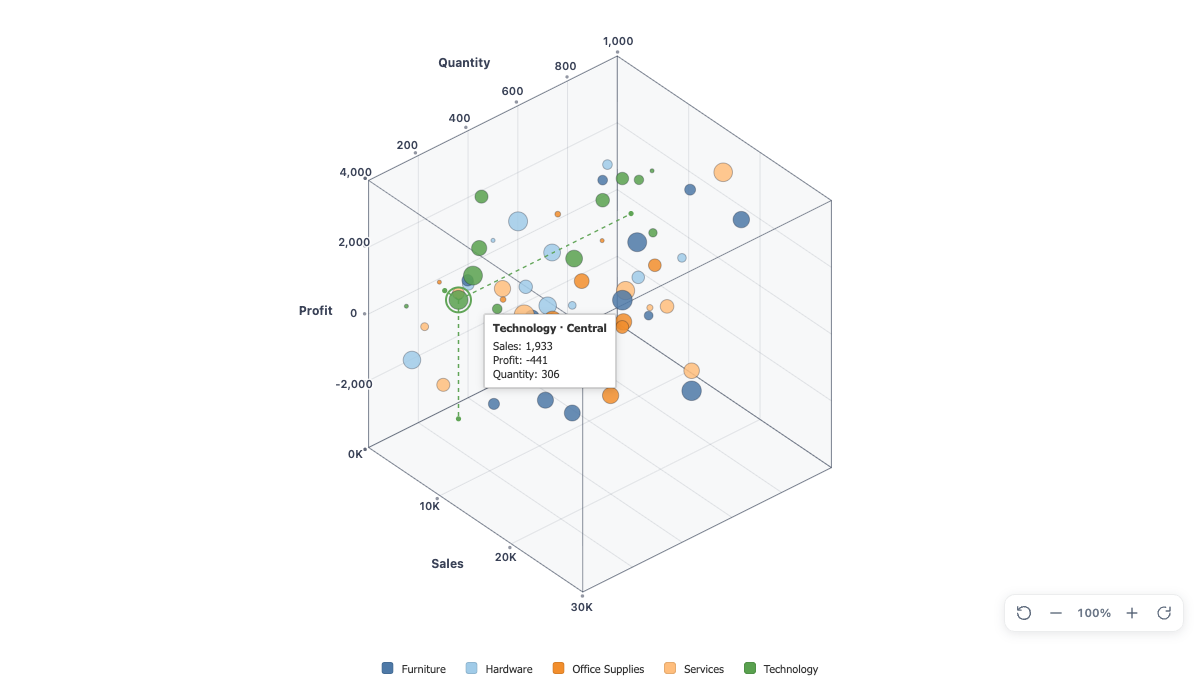
Explore every point
Hover a point and dashed guides project its coordinates onto the walls, with a templated tooltip you can pin with a click. Hover an axis and it names itself. Drag to rotate, zoom in and out, and double-click to return to the default view you saved for your viewers.
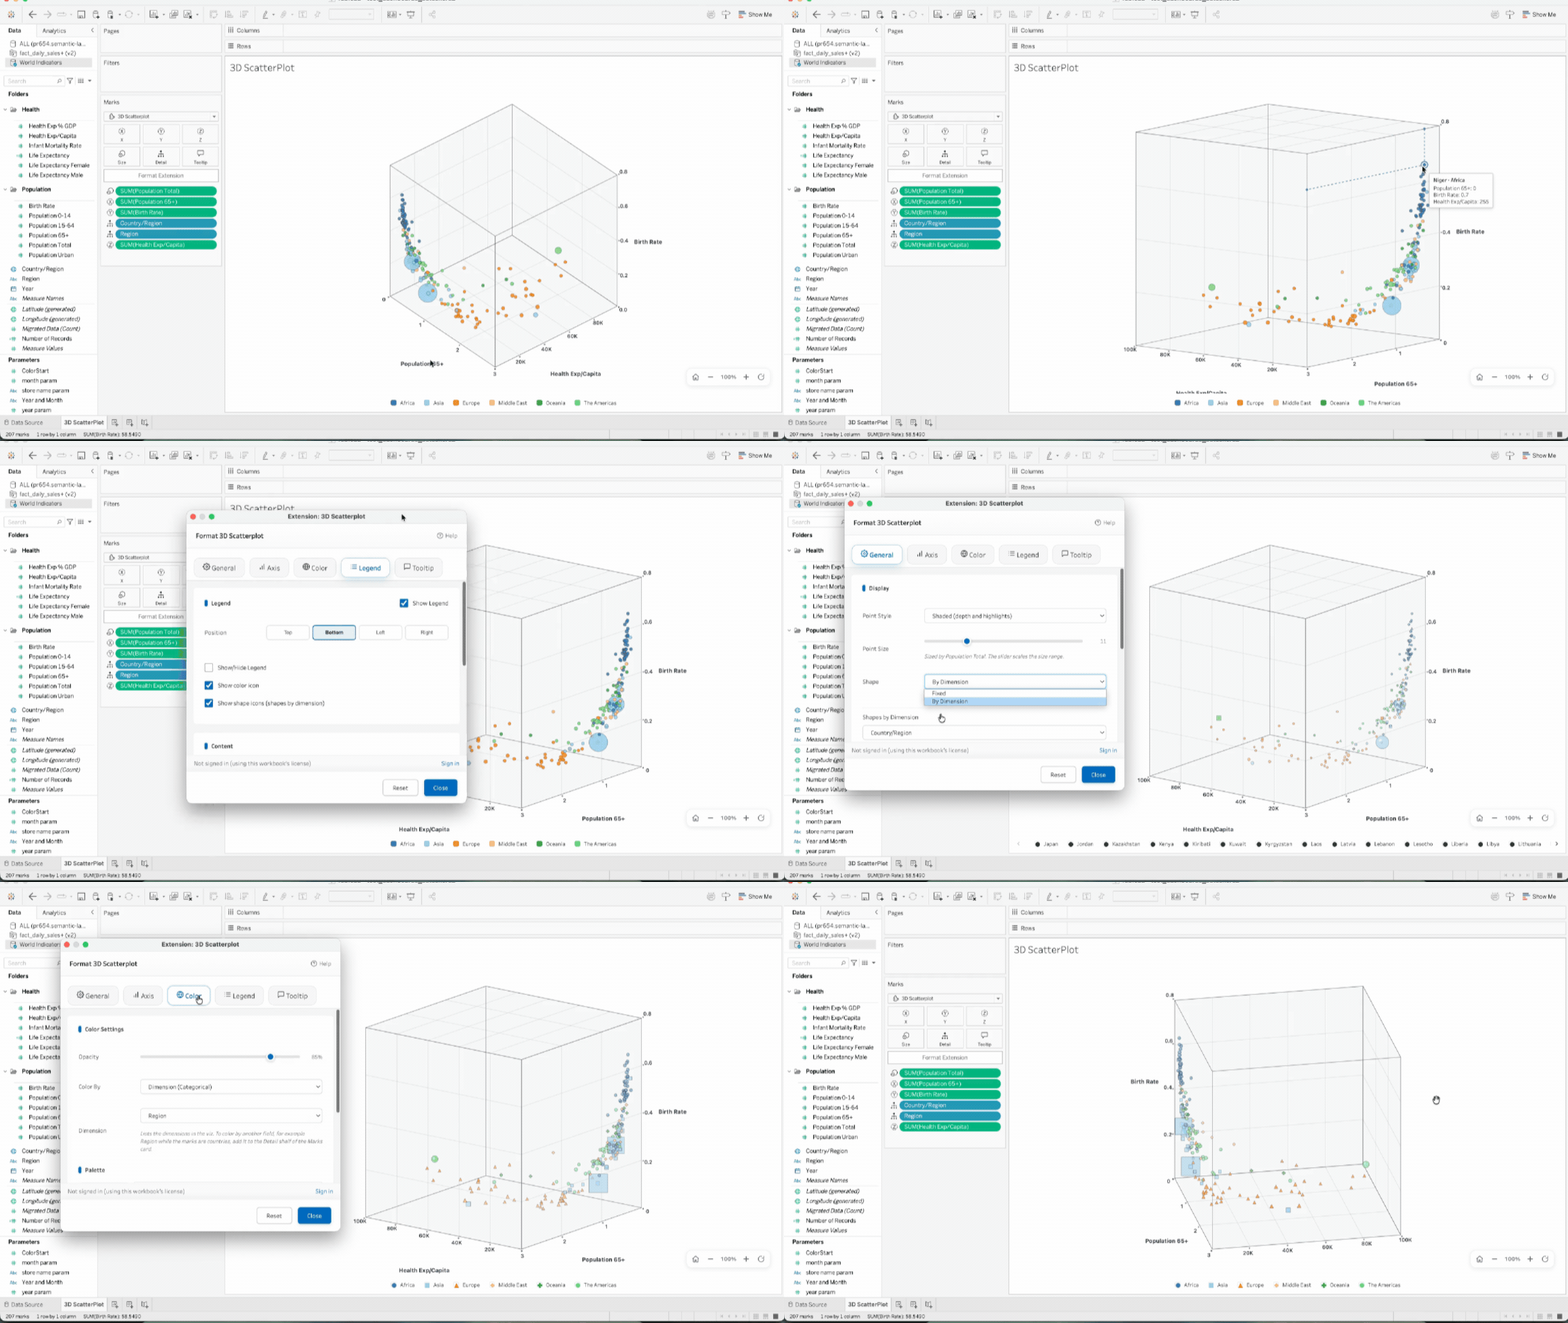
Make it yours
Choose orthographic or perspective projection, flat marks or a shaded style with depth and glow, five marker shapes, and categorical or continuous palettes with a precise color per member. Axes, gridlines, legend, and tooltip are all yours to format, on a light or dark background. Everything runs in your browser: your data never leaves your machine.