Calendar
Tableau Viz Extension
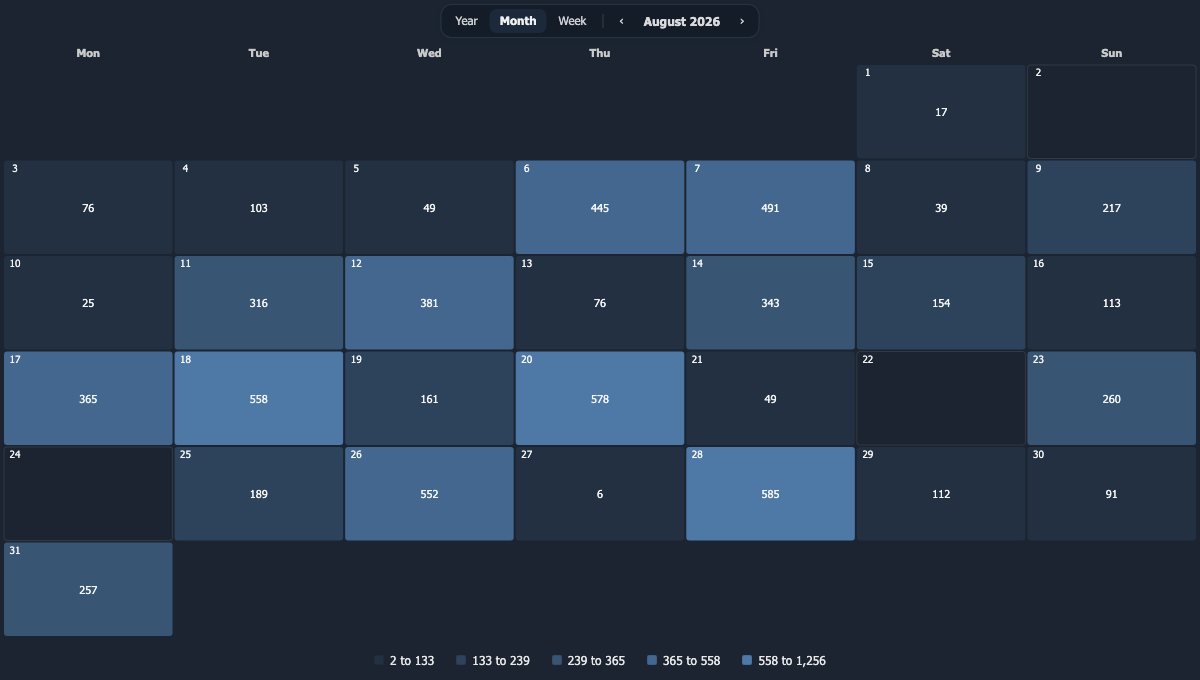
A year, a month or a week of days, each cell carrying color and value. A day with no data stays visibly empty: null is not zero.
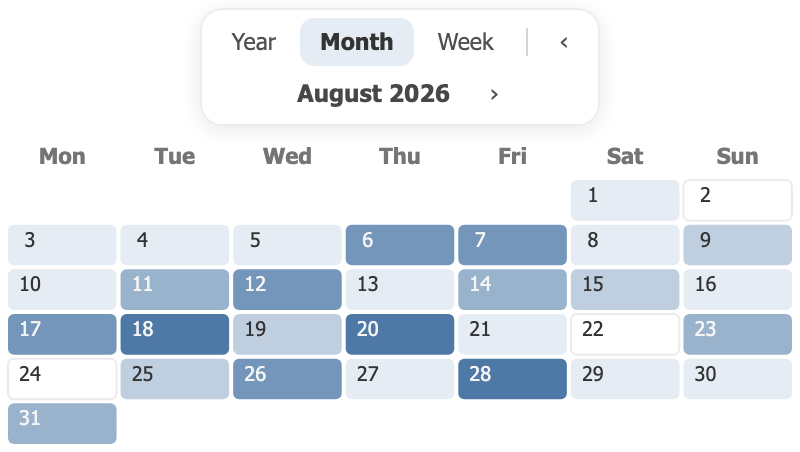
Three views the reader owns
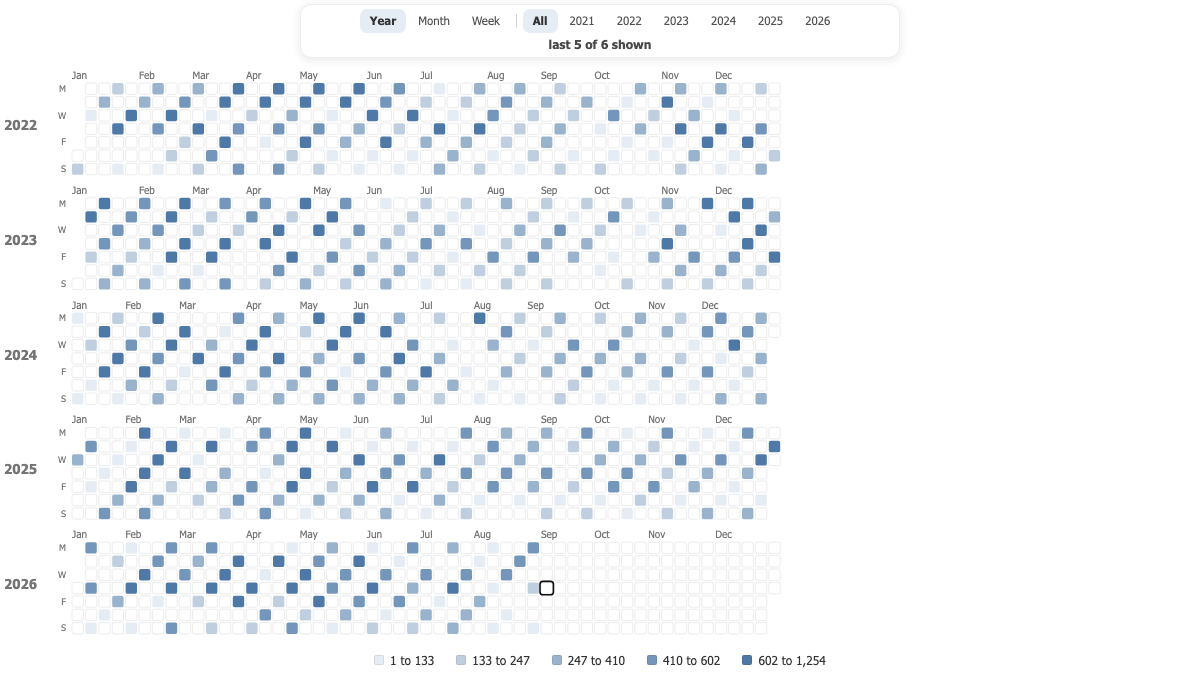
Year, Month and Week pills sit in the toolbar, a month label in the year view opens that month, a week number opens that week. The View setting is only the page the calendar opens on.
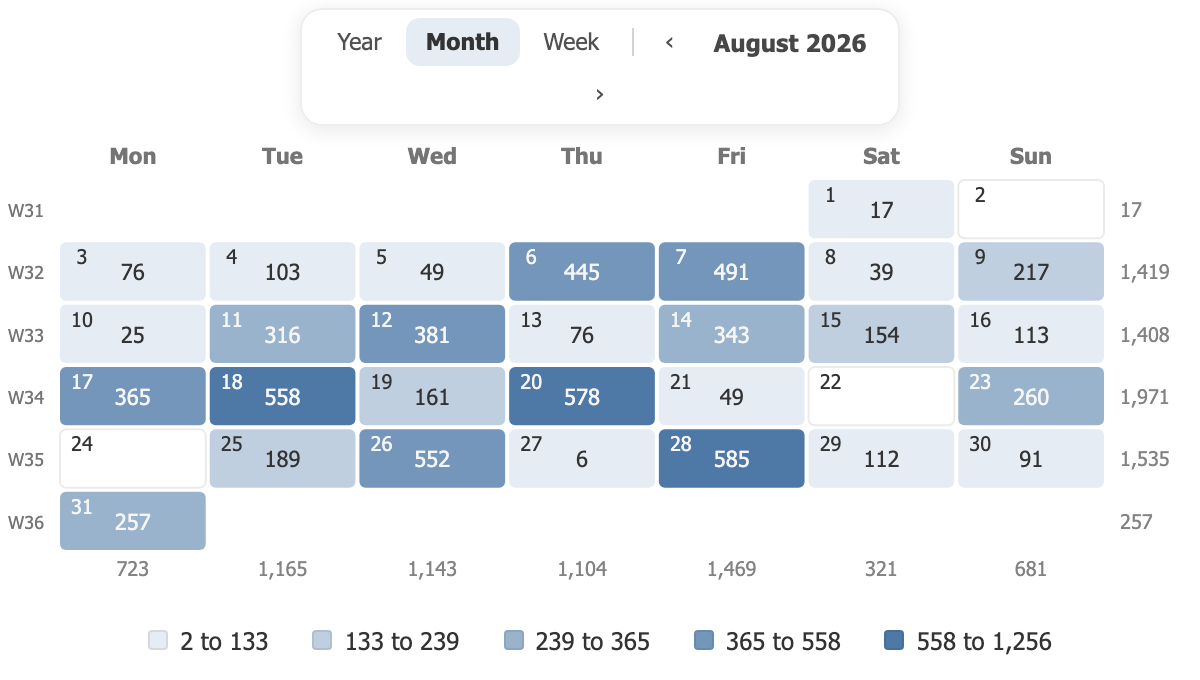
The month as a worksheet
Week numbers, week totals and weekday totals around the grid, each honoring the measure's own aggregation. A non-additive measure gets no made-up total, and the chart says why.
A scale outliers cannot wash out
The quantile scale puts a fifth of the days in each shade, the way the GitHub contribution graph reads, so one exceptional day cannot fade the rest. Mixed signs switch to a diverging scale around zero.