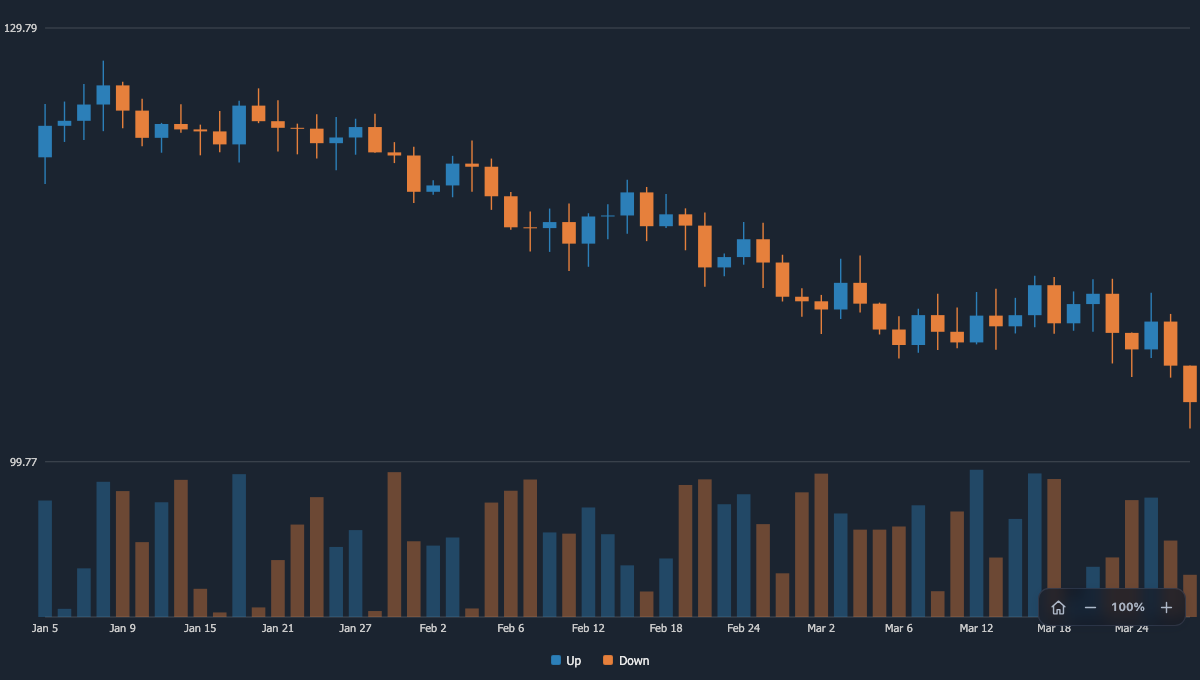
Candlestick Chart
Tableau Viz Extension
Open, high, low and close over time, with an optional volume panel and moving average. For prices, and for any series tracked as first, peak, trough and last.
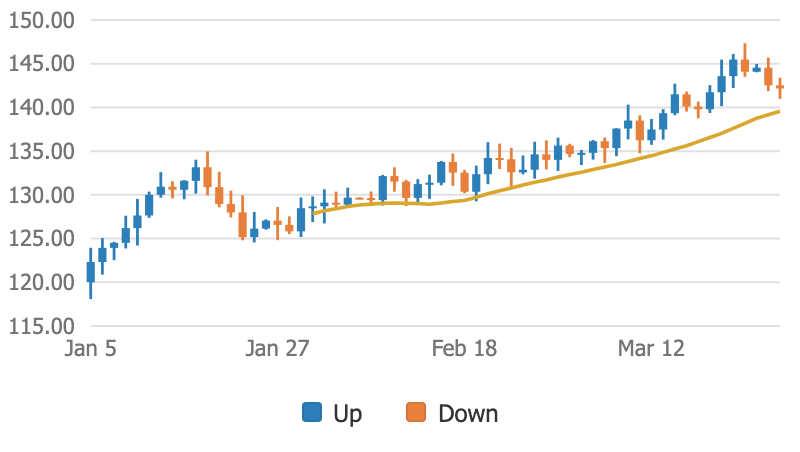
Four measures, or just one
Drop open, high, low and close on the OHLC shelf, or a single measure: the chart then builds each candle from the first, highest, lowest and last value per day, week or month, choosing the period that keeps the candles readable.
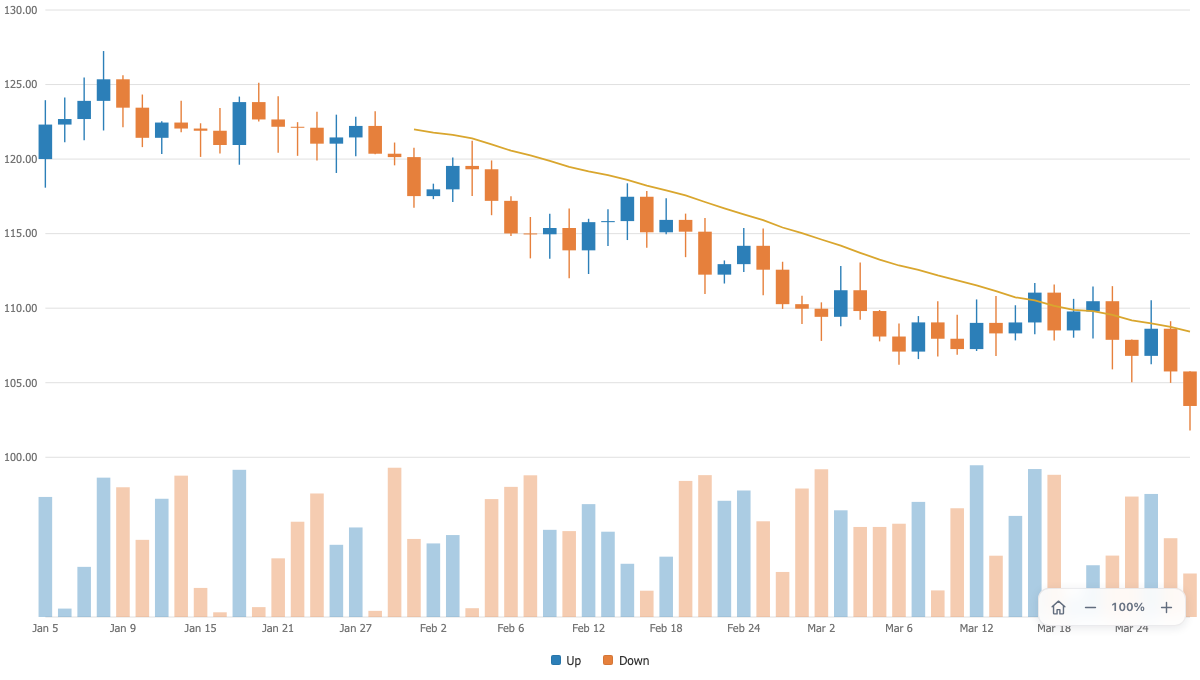
Volume and trend together
An optional volume panel sits under the candles, colored by the candle's direction, and a moving average with a configurable window runs through them.
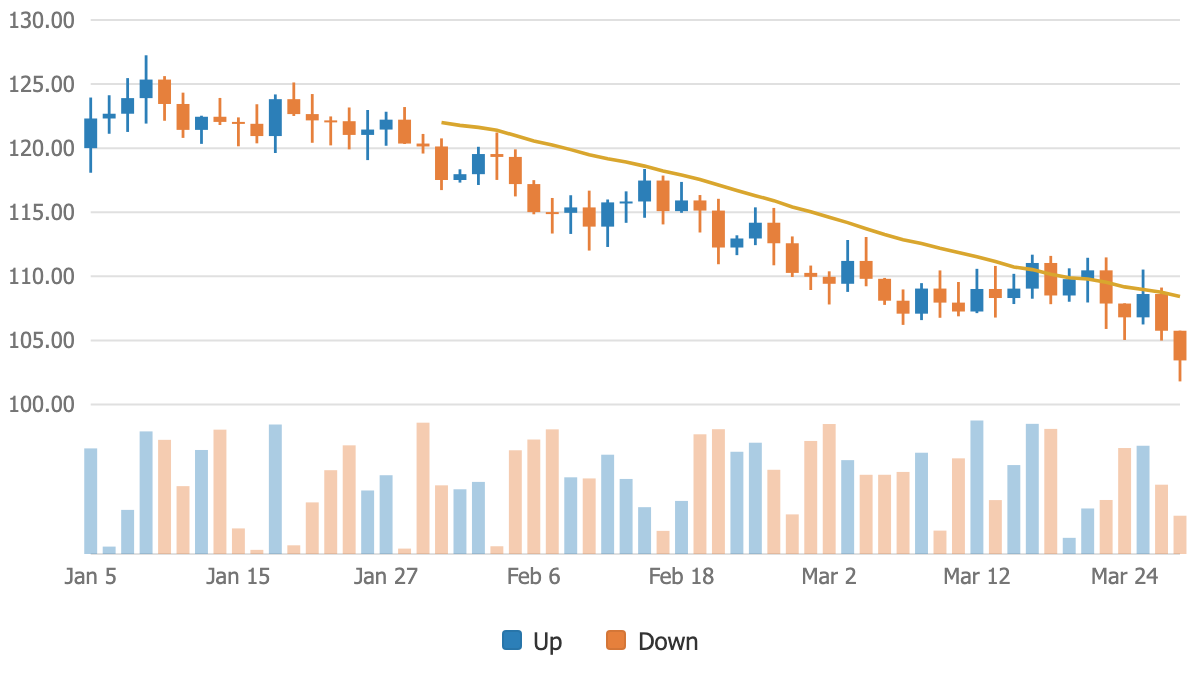
Log scale, dark grounds
A logarithmic price scale for long series, and every part of the chart recolors itself for a dark dashboard, down to the axis text.