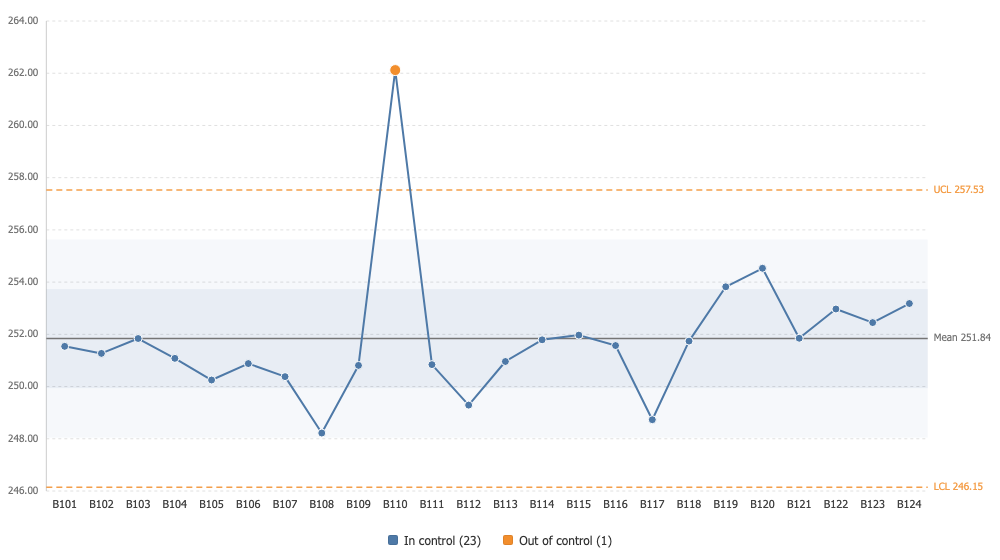
Control Chart
Statistical process control inside Tableau: control limits from the moving range, the Nelson rules, and every flagged point naming the rule that flagged it.
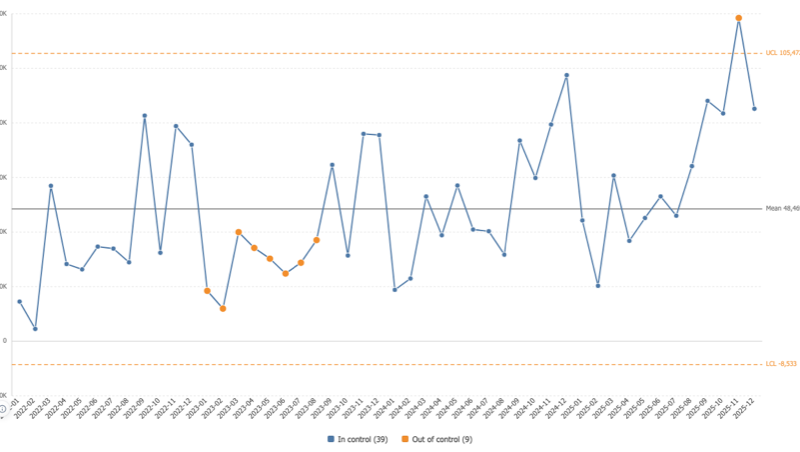
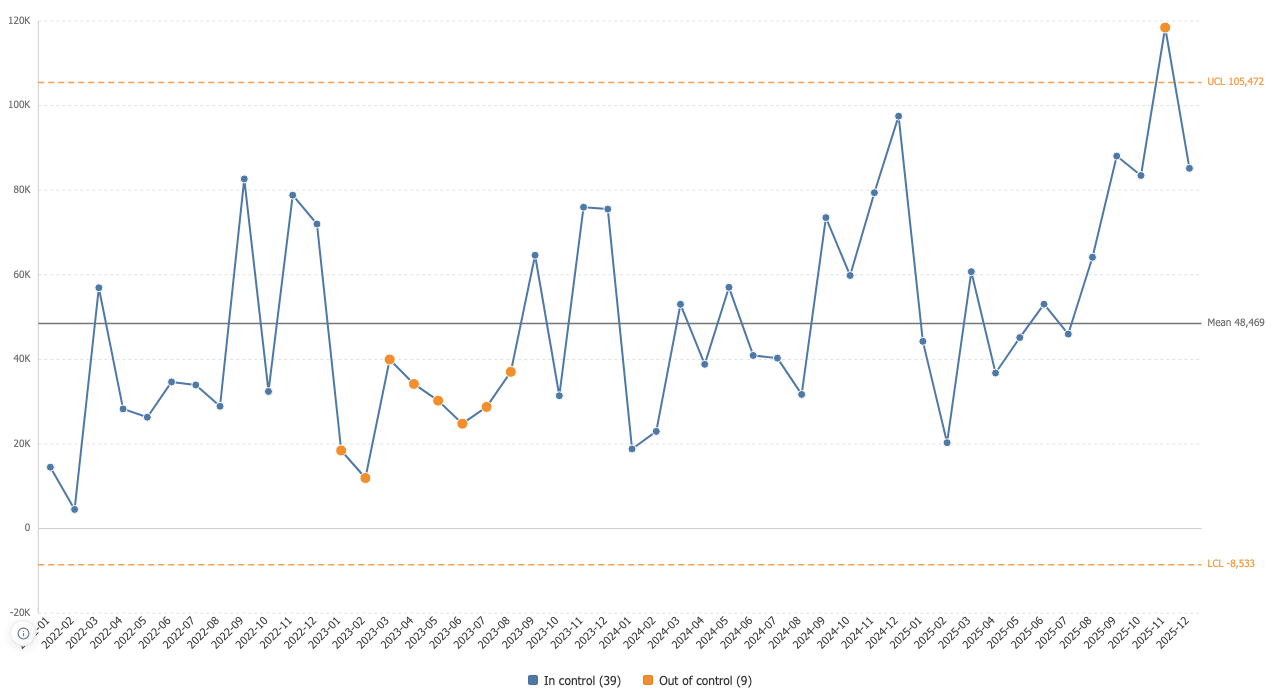
Limits that do not hide the drift
Sigma is estimated from the moving range of consecutive points, so a shift in the process cannot widen the limits meant to catch it. The standard deviation is there when you want it, and the limits carry their numbers.
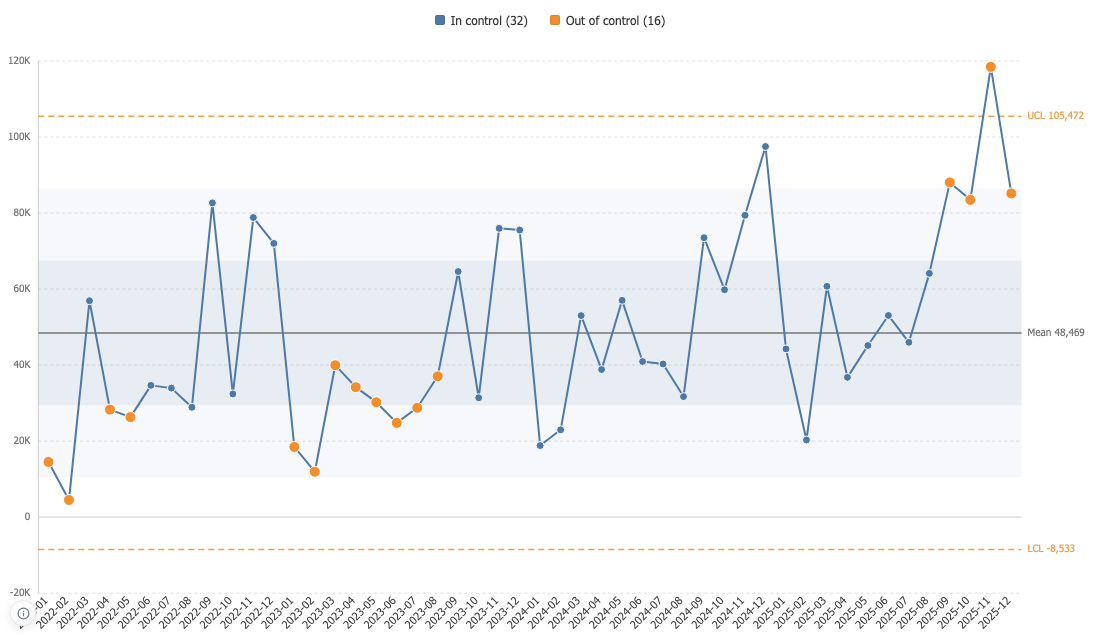
The Nelson rules, and which one fired
Beyond the limits, a run on one side of the centre line, a steady rise or fall, two of three past two sigma, four of five past one. Each is yours to turn on, and the tooltip on a flagged point names the rule rather than leaving you to re-derive it.
Honest about its own arithmetic
No variation means no limits, and the chart says so instead of drawing three lines on top of each other. A lower limit below zero on a measure that never goes negative is declared rather than left as an unexplained empty band.