Correlation Matrix
Which of these measures move together, computed in your browser from the rows on the sheet, with the method named and the sample size behind every cell.
Computed, not looked up
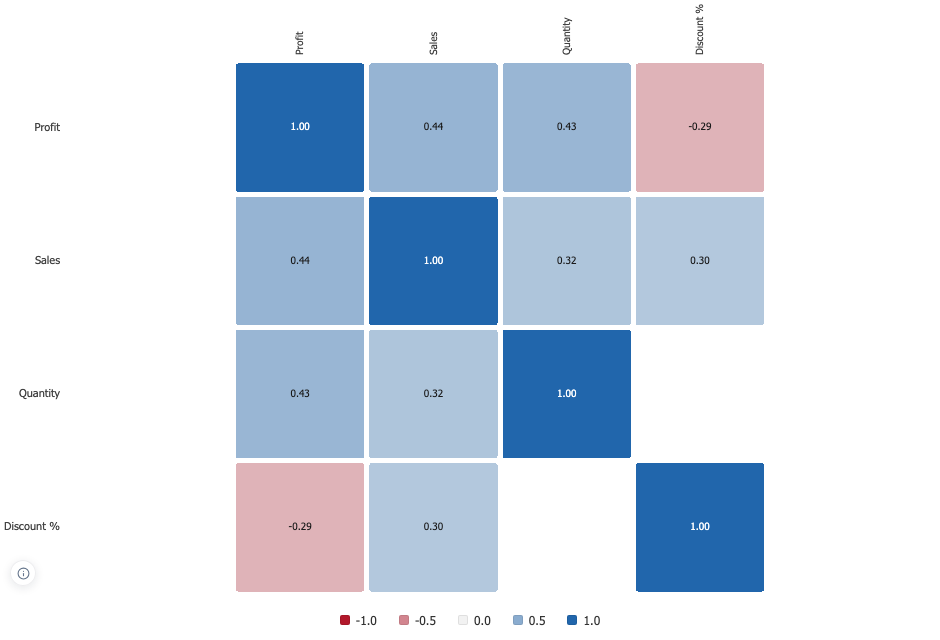
Drag two to ten measures onto one shelf and the dimension that defines an observation onto Level of Detail. On Superstore at sub-category and region, sixty-eight observations, discounting correlates plus 0.30 with sales and minus 0.29 with profit: it sells more and earns less, which is the sort of thing you find in ten seconds here and never find in a bar chart.
Pearson or Spearman, and the chart says which
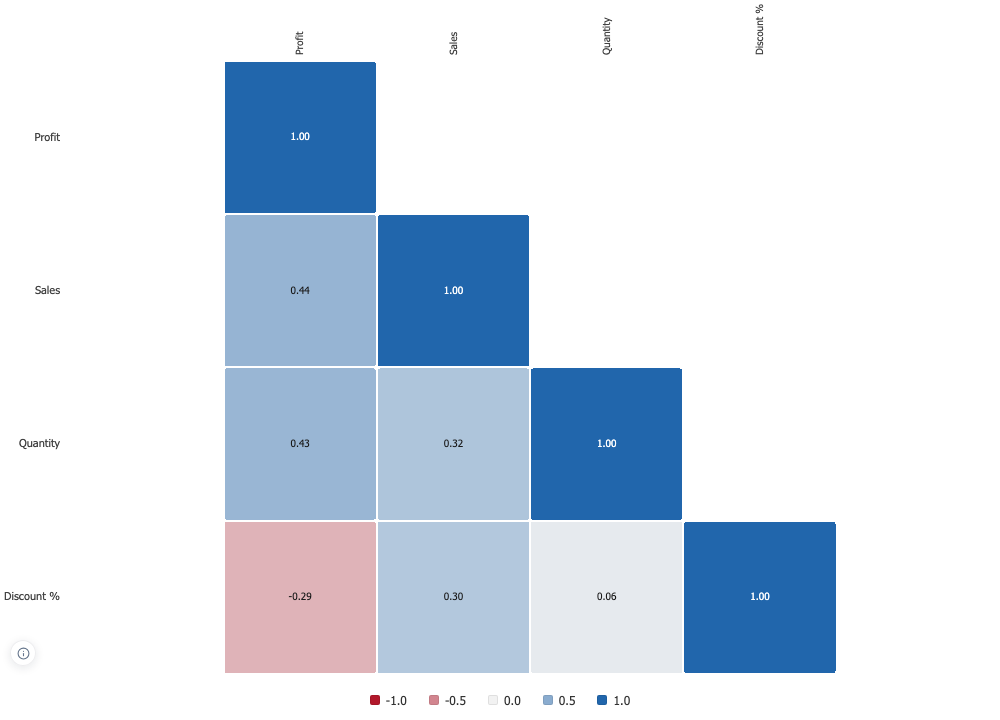
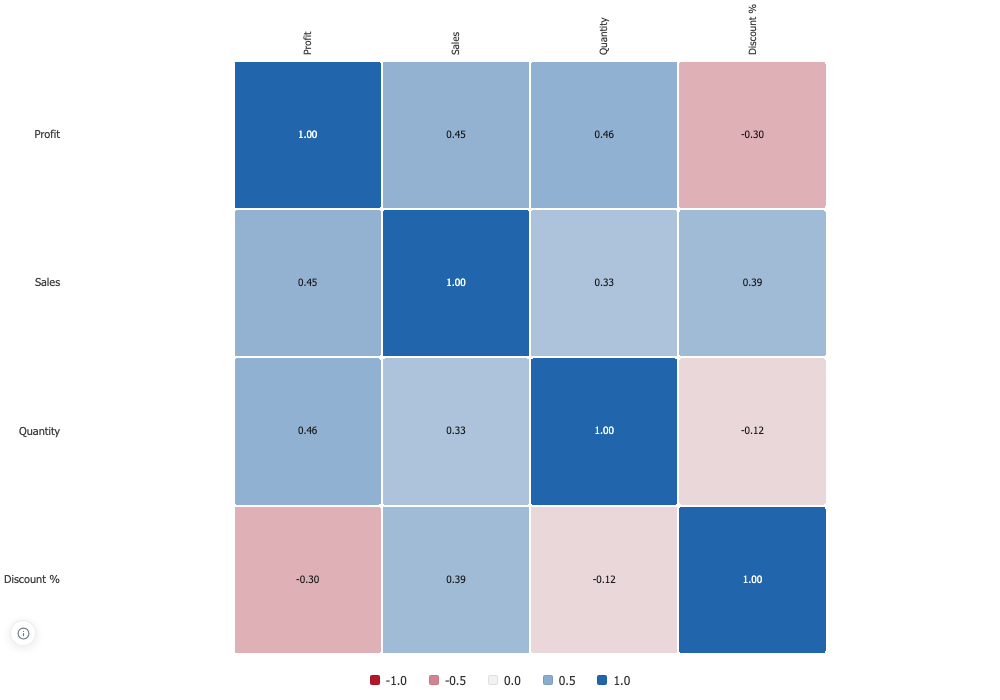
Pearson compares values, finds straight-line relationships and can be carried by one extreme row. Spearman compares ranks, so no single outlier decides the answer and a relationship that is steady but not straight still shows. Whichever ran, the chart names it and reports how many rows it saw.
Ordered so the blocks surface
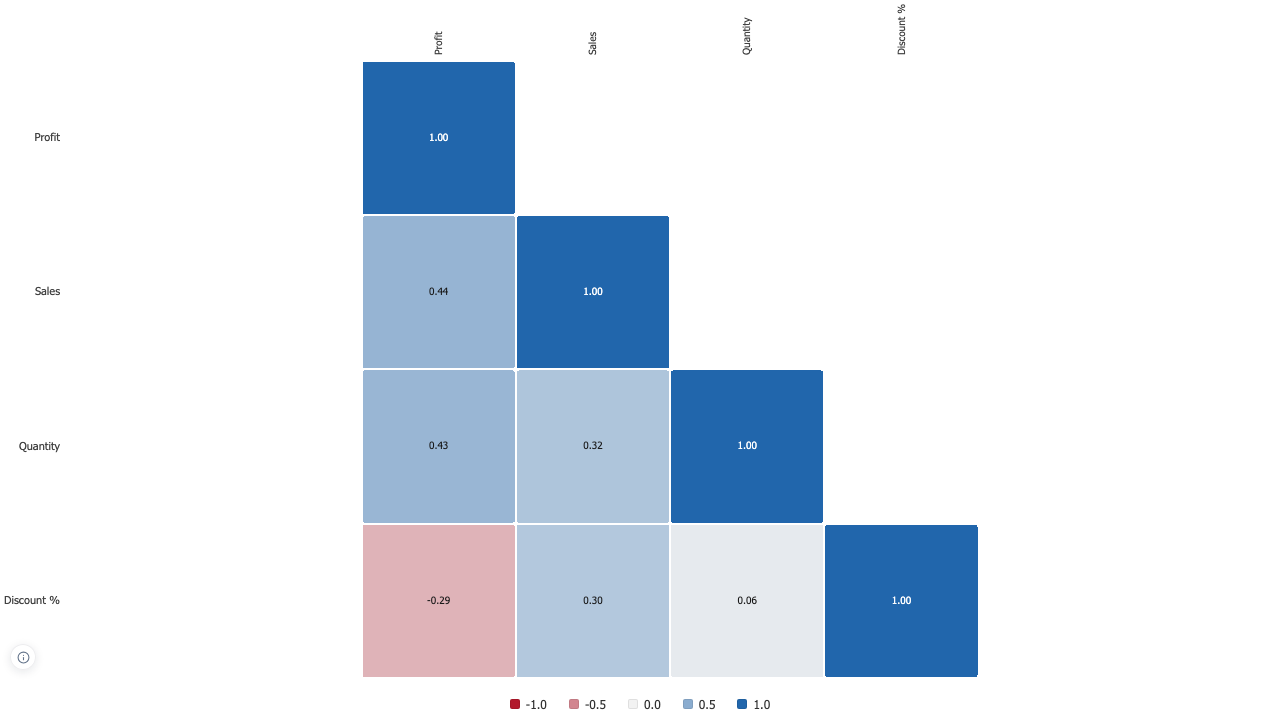
Ordering by strength puts the measures that explain each other next to each other. The matrix is symmetric so it draws one half by default rather than printing every coefficient twice, and the weak relationships can be hidden, with the hidden ones counted so nobody reads a gap as an absence of data.