Gantt Chart
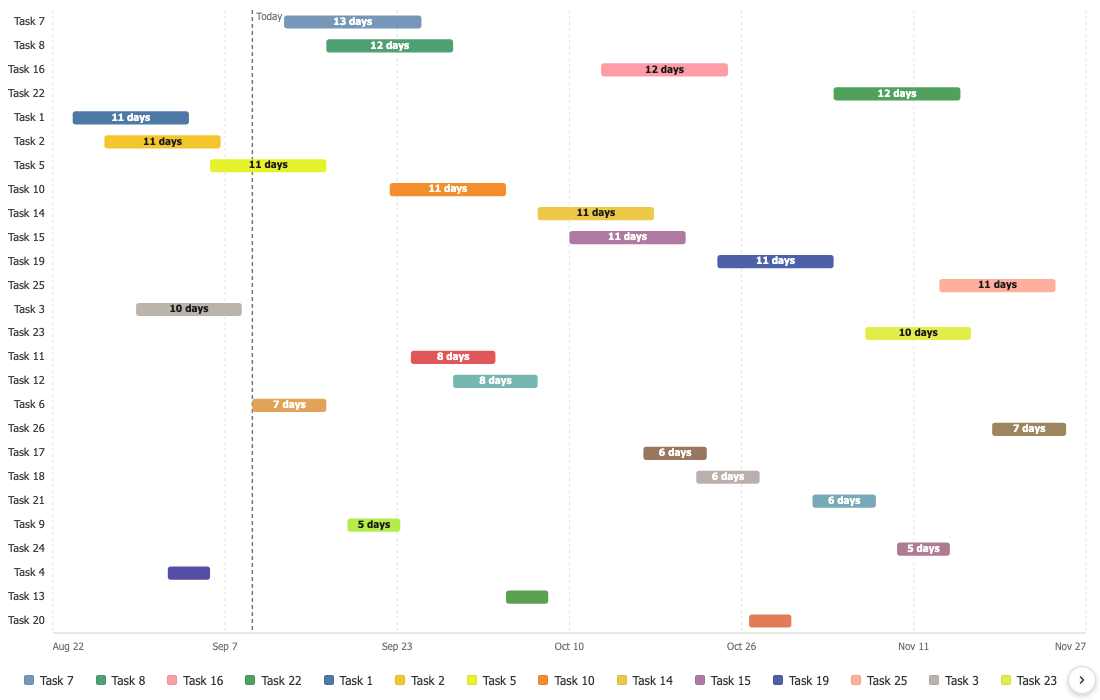
One bar per task from a start to an end, with completion drawn inside the bar and the work that should have been done by now shown as a shortfall.
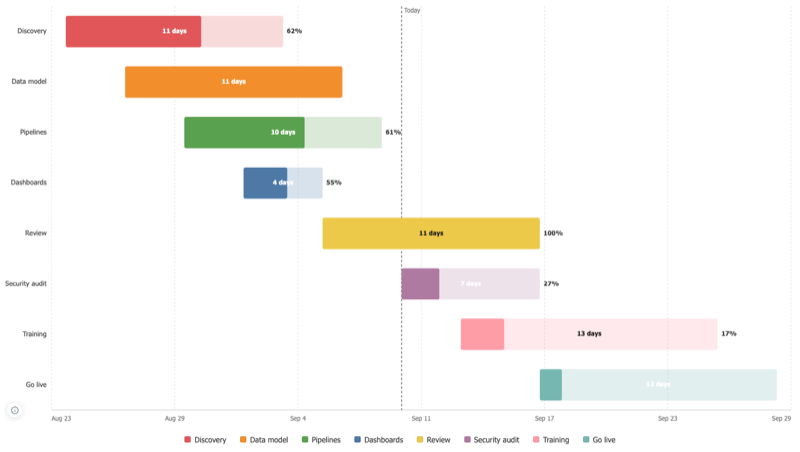
Completion inside the bar
A task with a completion value turns its bar into a track and fills it, so the progress reads at any opacity. The value is taken as nought to one or as nought to a hundred, decided once for the whole column and stated, because deciding row by row would read a single overshoot as a fraction of a percent.
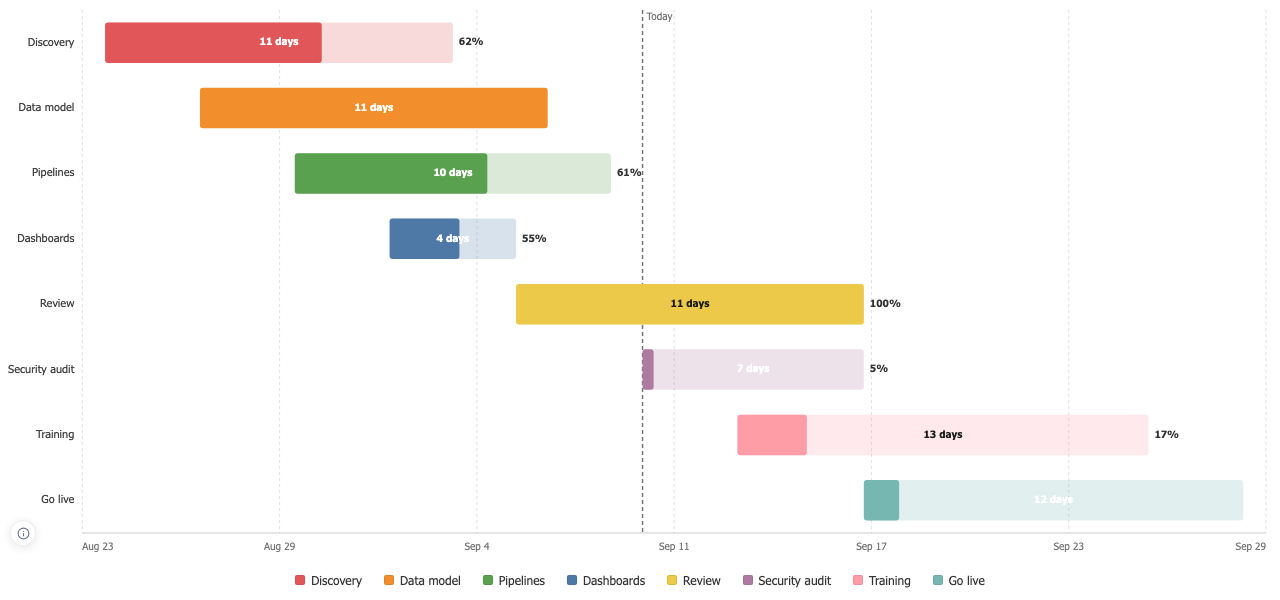
The work that is late, shaded
A task less complete than the share of its own schedule already elapsed shows the gap between where the work has got to and where today falls on that bar. A vertical mark at the elapsed share would sit on the Today line every time and say nothing new.
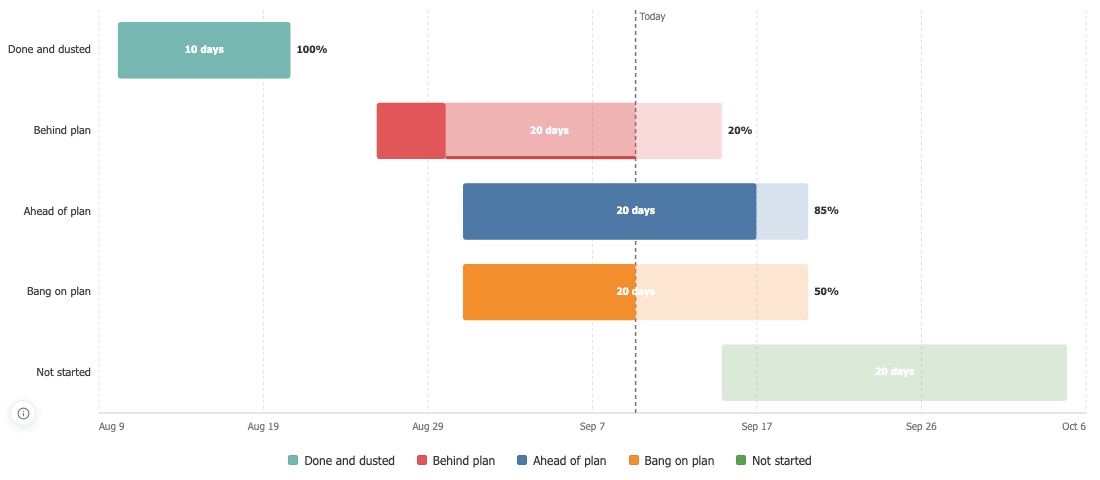
Dates or numbers, long plans included
Start and End take dates or plain numbers, so a set of ranges works as well as a schedule. Sort by start, end or duration, and a task whose two ends arrive the wrong way round is swapped and declared rather than drawn backwards.