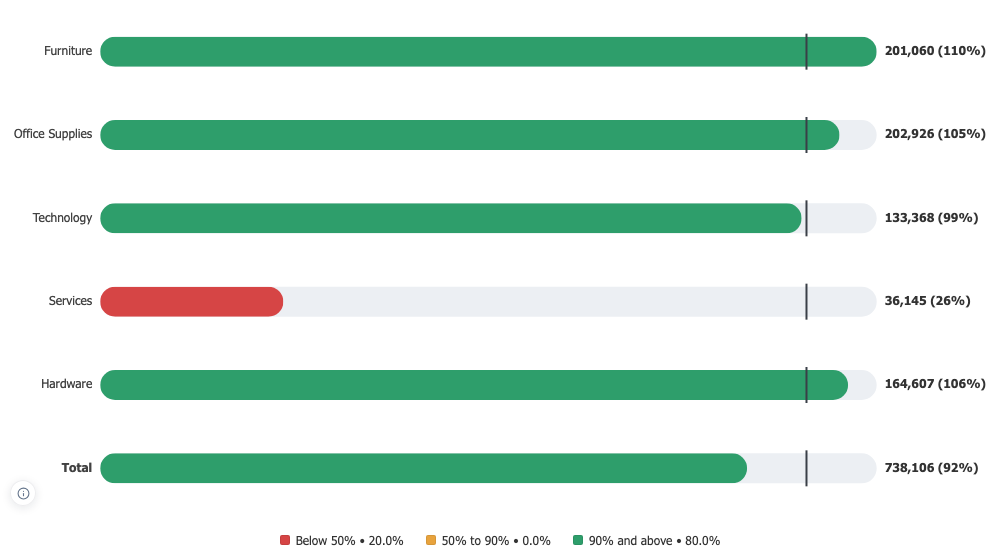
Progress Bar
Progress towards a target, one bar per category, with the target marked and an overall row computed from the totals.
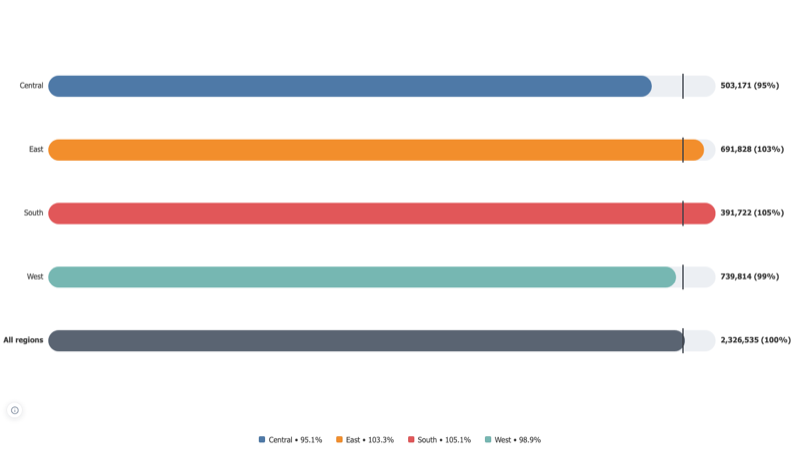
The target is on the track
A marker where the goal sits, the bar filling towards it, and the value, the percentage or both at the end. Past target the track stretches so every bar stays on one scale, and the chart says it did.
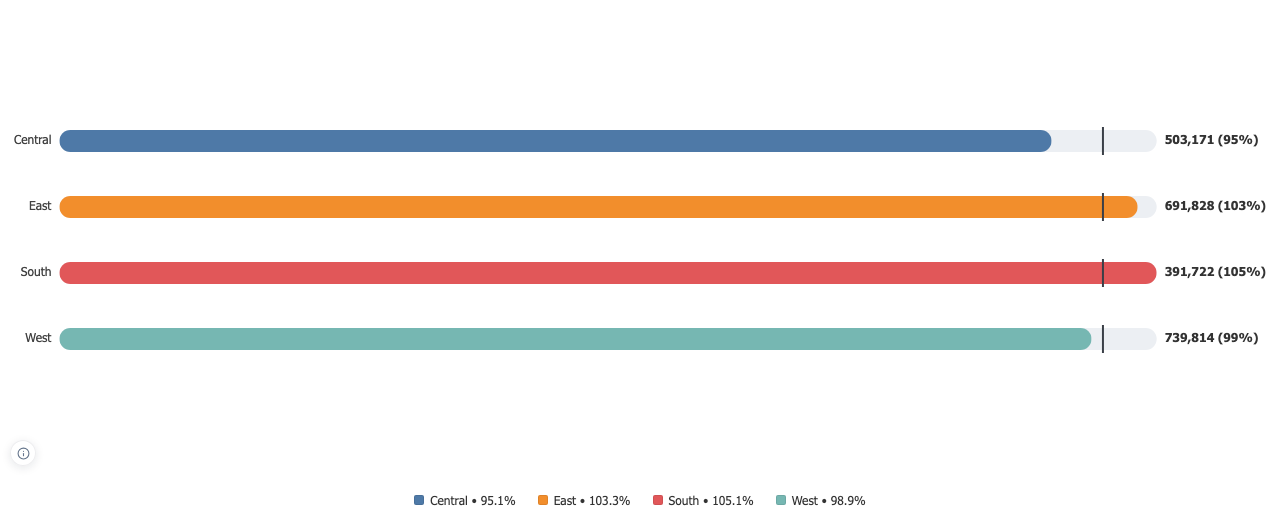
An overall row that adds up
It divides the sum of the values by the sum of the targets. Averaging the per-category percentages would let one small category at three hundred percent carry the whole number. The row is neutral, not a palette colour, and it is never clickable, because a total is not something you can filter a dashboard on.
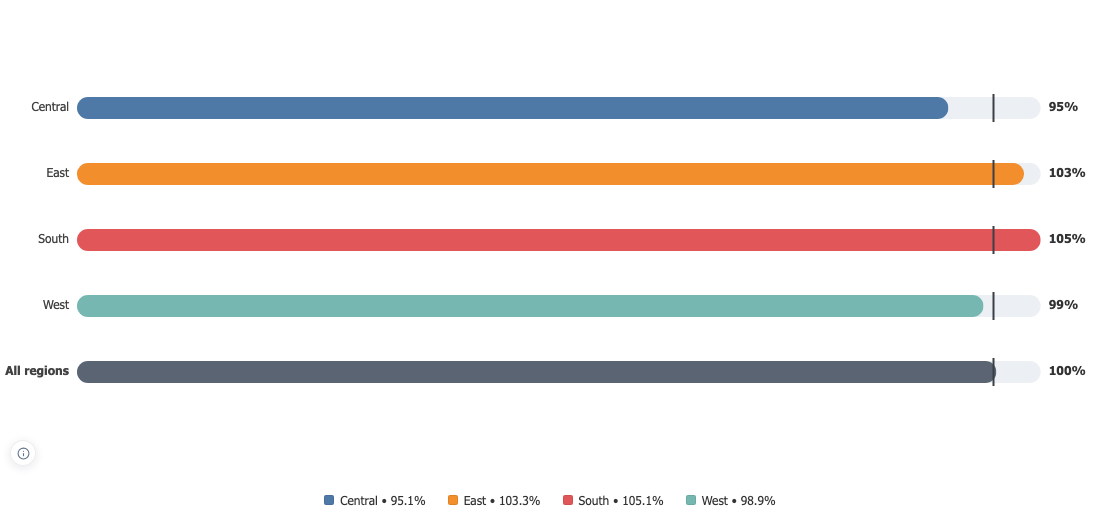
Colour that carries the status
One colour, a colour per category, or your own thresholds for danger, warning and success, so a bar that needs attention reads before any number does.