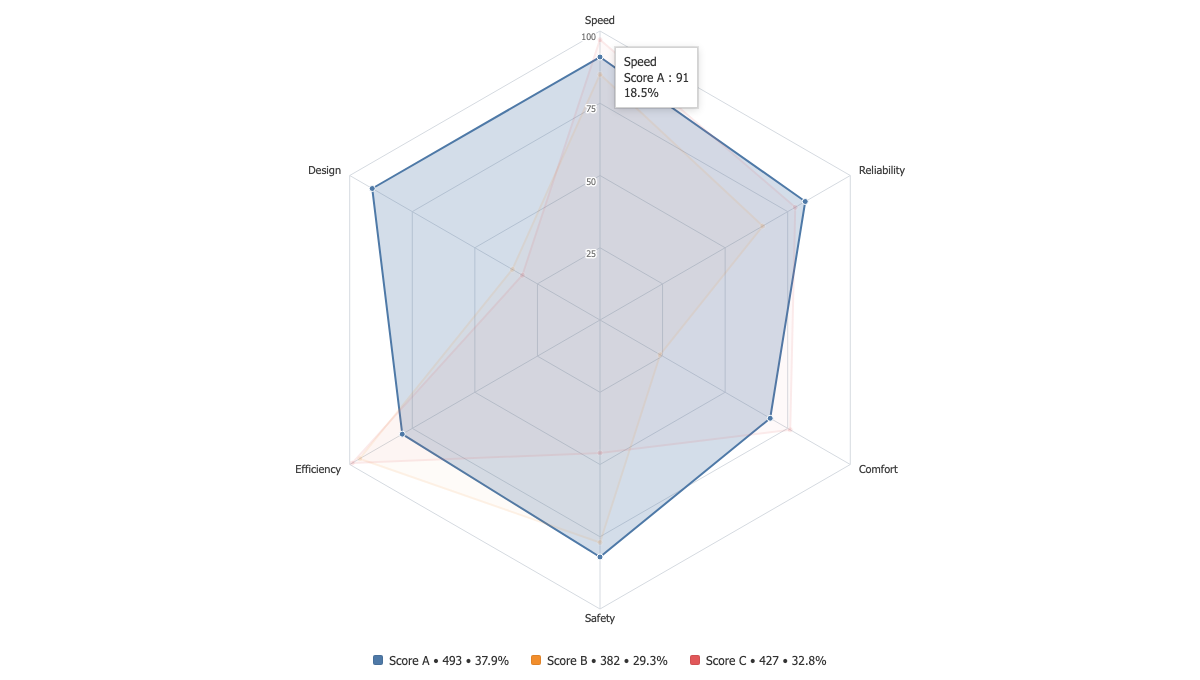
Radar Chart
Tableau Viz Extension
Compare several measures, or several series across the same axes, on one circular grid.
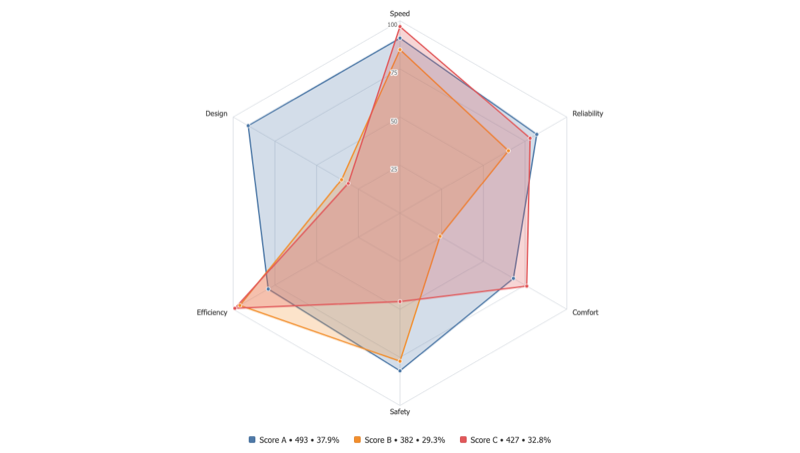
One shape per series
Drop several measures for one series each, or a single measure with a dimension for one shape per value. Both shapes of data draw the same chart.
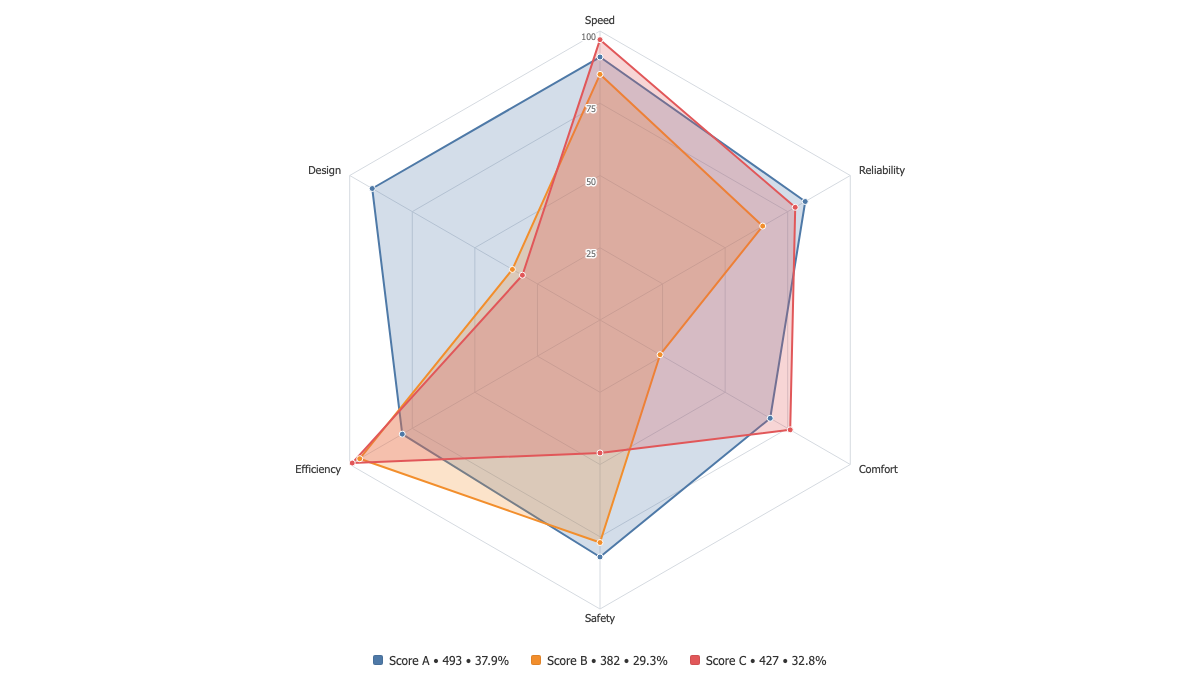
Readable at a glance
Axis labels, rings and their values are all optional and all measured before they are drawn, so a crowded chart drops what does not fit rather than overlapping it.
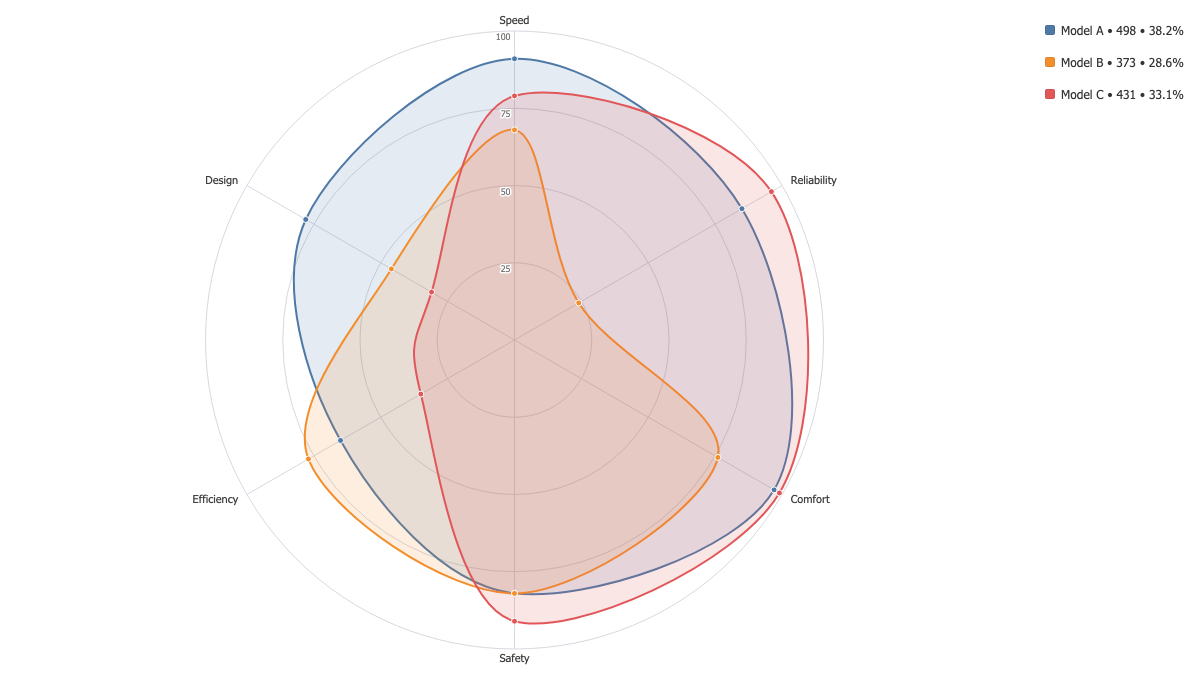
The formatting you expect
Colours, opacity, legend and tooltip use the same panel as every other Dataskera extension, so a dashboard built from several of them stays consistent.