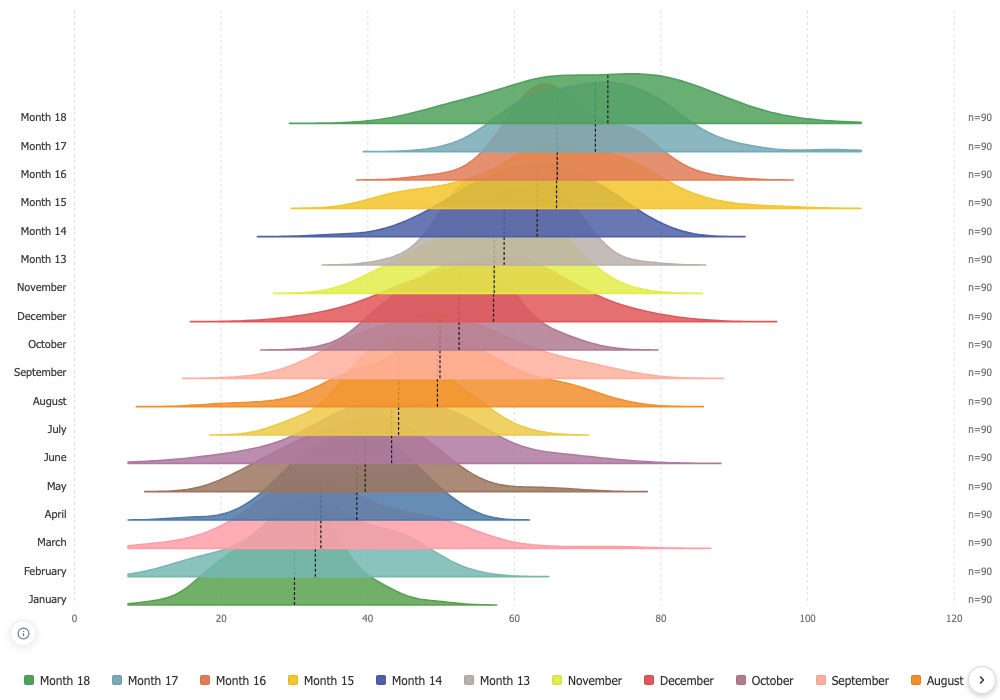
Ridgeline Chart
One density curve per group, overlapping down a shared axis, for comparing many distributions on a single page.
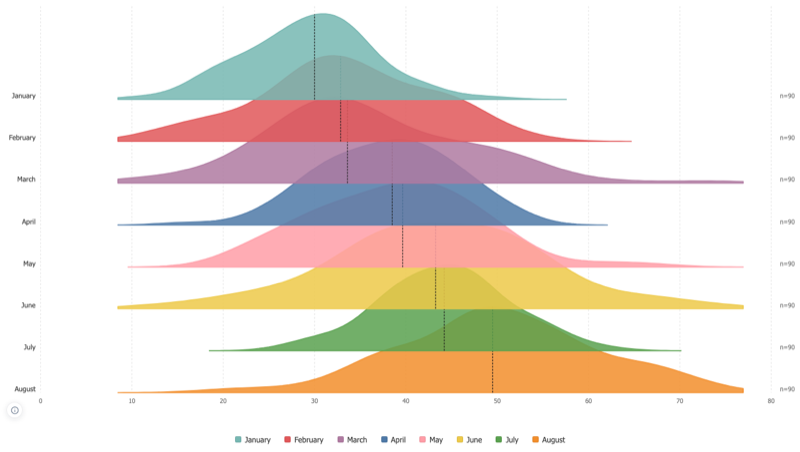
Overlap is the point, and it is yours
At nothing the ridges are small multiples; high up they sit almost on top of each other and a year fits in a pane. They are drawn back to front, so a ridge is always covered by the one below it and never the other way round.
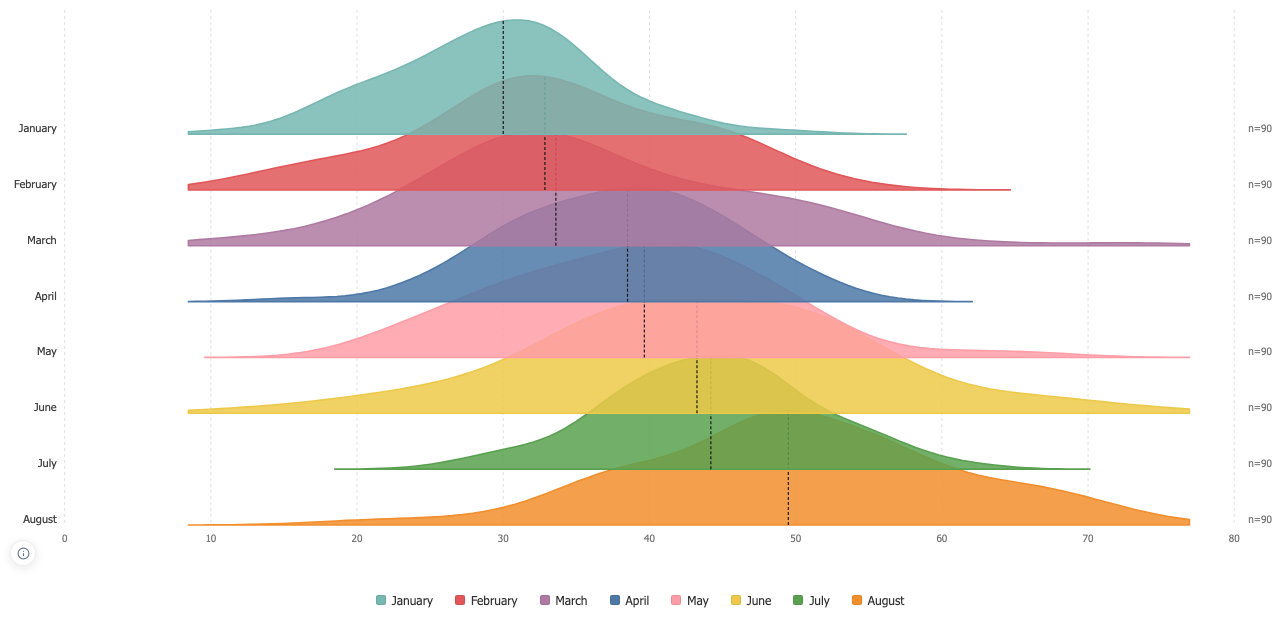
A curve that keeps its humps
Silverman's rule of thumb, the same estimator the Violin Plot uses, so two Dataskera charts of the same data agree with each other. Two peaks survive as two peaks, and the smoothing is a multiplier on that estimator rather than a replacement for it.
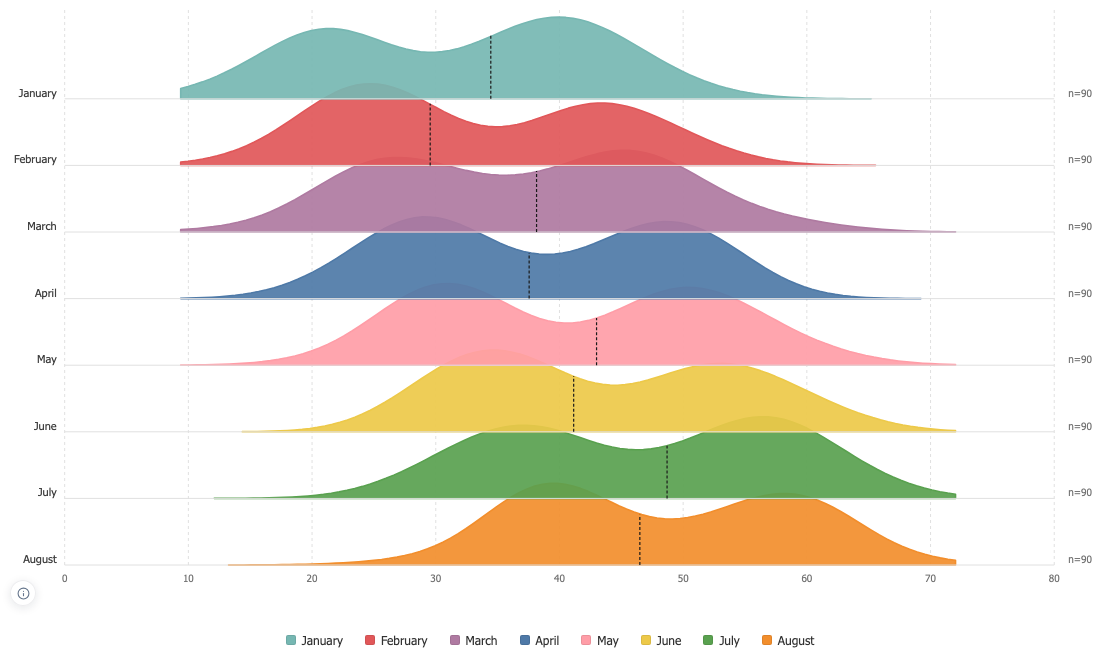
Height means one thing or the other
Scaled to its own peak, every ridge fills its row and the heights show shape only. On a shared scale the heights become comparable and a thin group looks as flat as it really is. The chart says which of the two you are looking at, and holds back groups too small to carry a density at all.