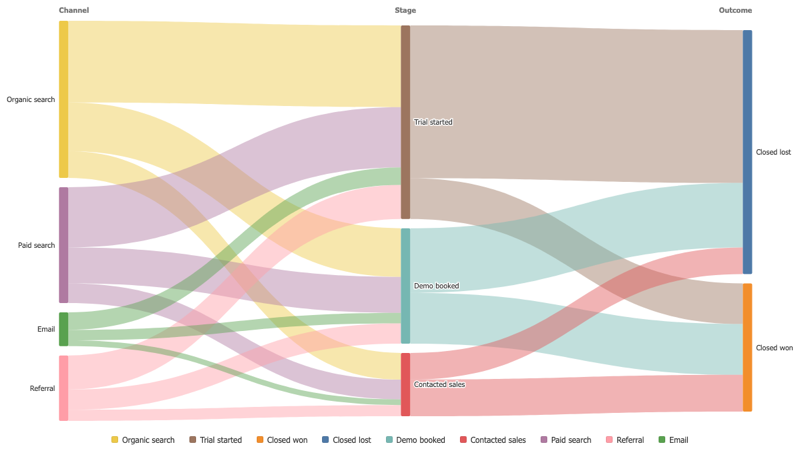
Sankey Diagram
Tableau Viz Extension
Follow a quantity as it splits and merges from one stage to the next, and see where the flow stops.
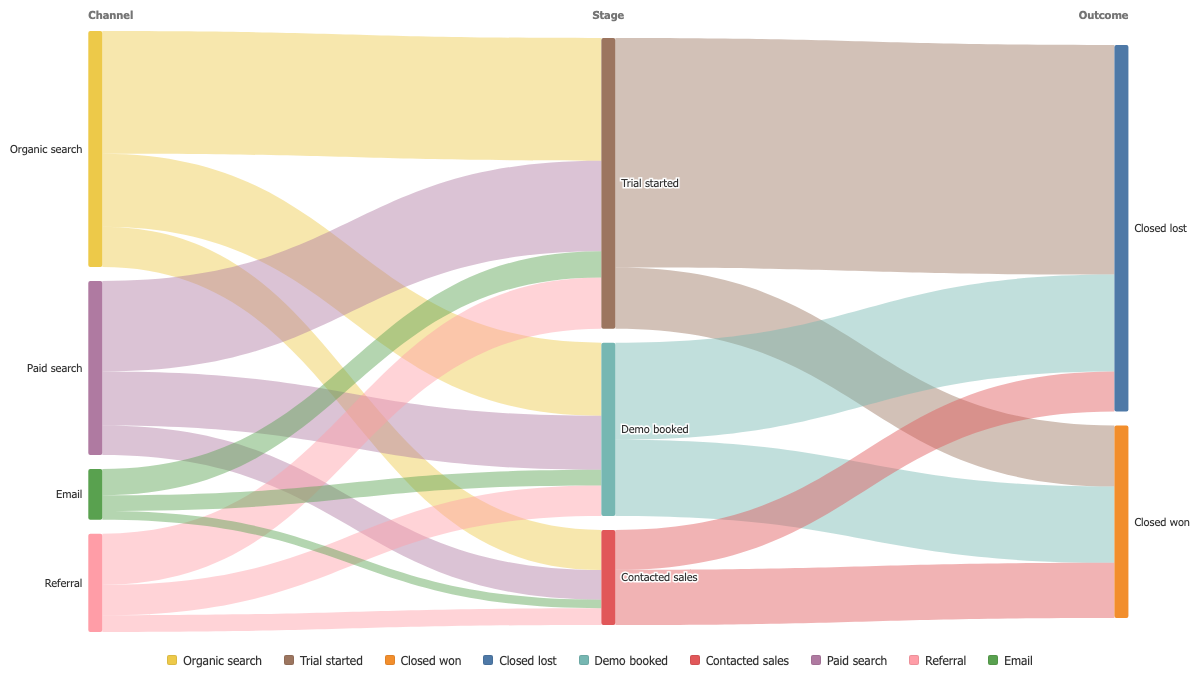
Two stages or five
Drop the dimensions on Levels in the order the flow runs. Two levels give a plain source to target diagram, five give a full path through your data.
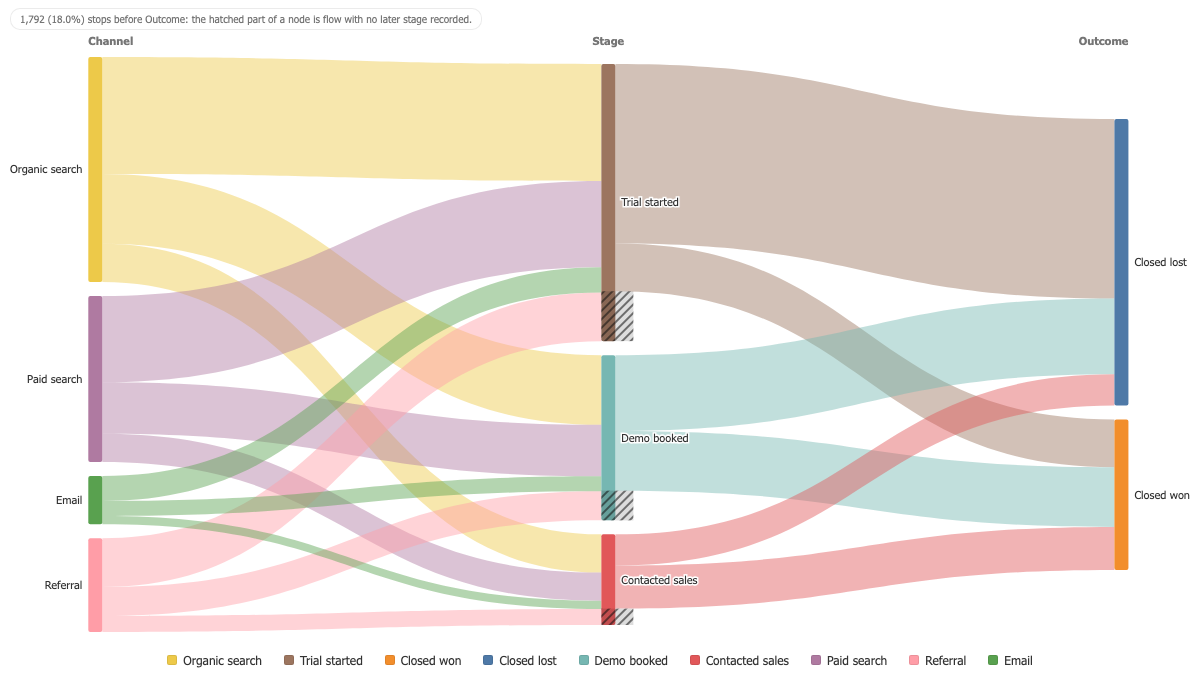
Flow that stops is shown, not dropped
A path runs as far as its filled stages. The part of a node that carries on nowhere is hatched and totalled under the chart, so a diagram that does not add up says so.
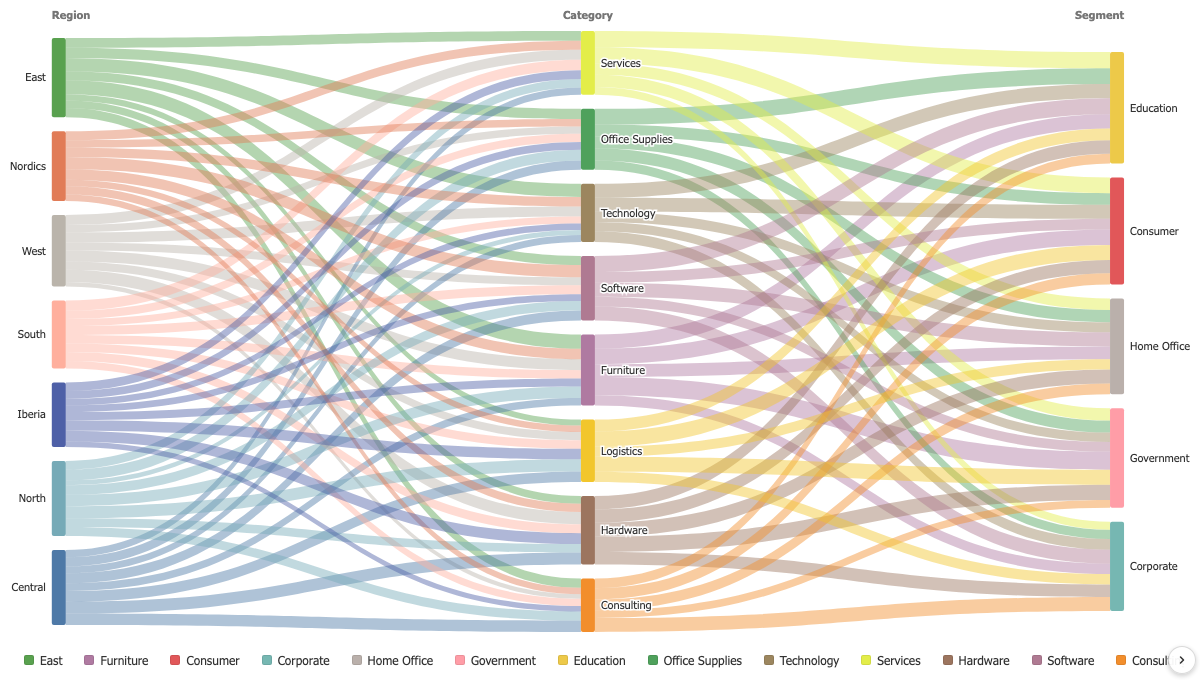
Readable when it gets busy
Ribbons crossing each other is what makes a Sankey hard to read. The default order sweeps the diagram back and forth, settling each node next to the ones it exchanges the most with.