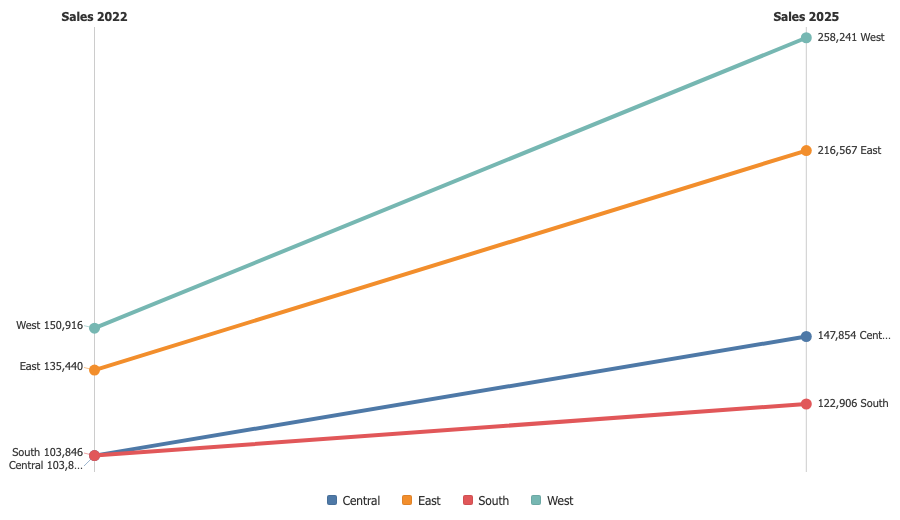
Slope Chart
Tableau Viz Extension
Two columns, one line per category between them. Rank changes and crossings read at a glance.
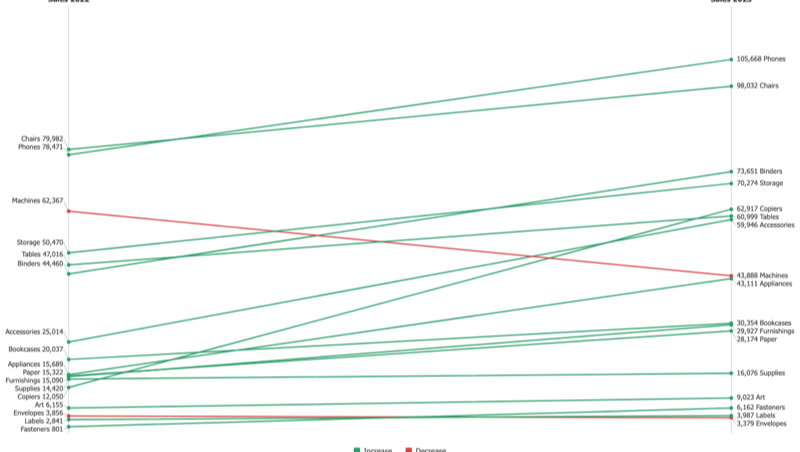
Direction in colour
Every rise in one colour, every fall in another, and the legend counts them. On Superstore between 2022 and 2025, fifteen sub-categories rose and exactly two fell, and the two red lines are the whole story.
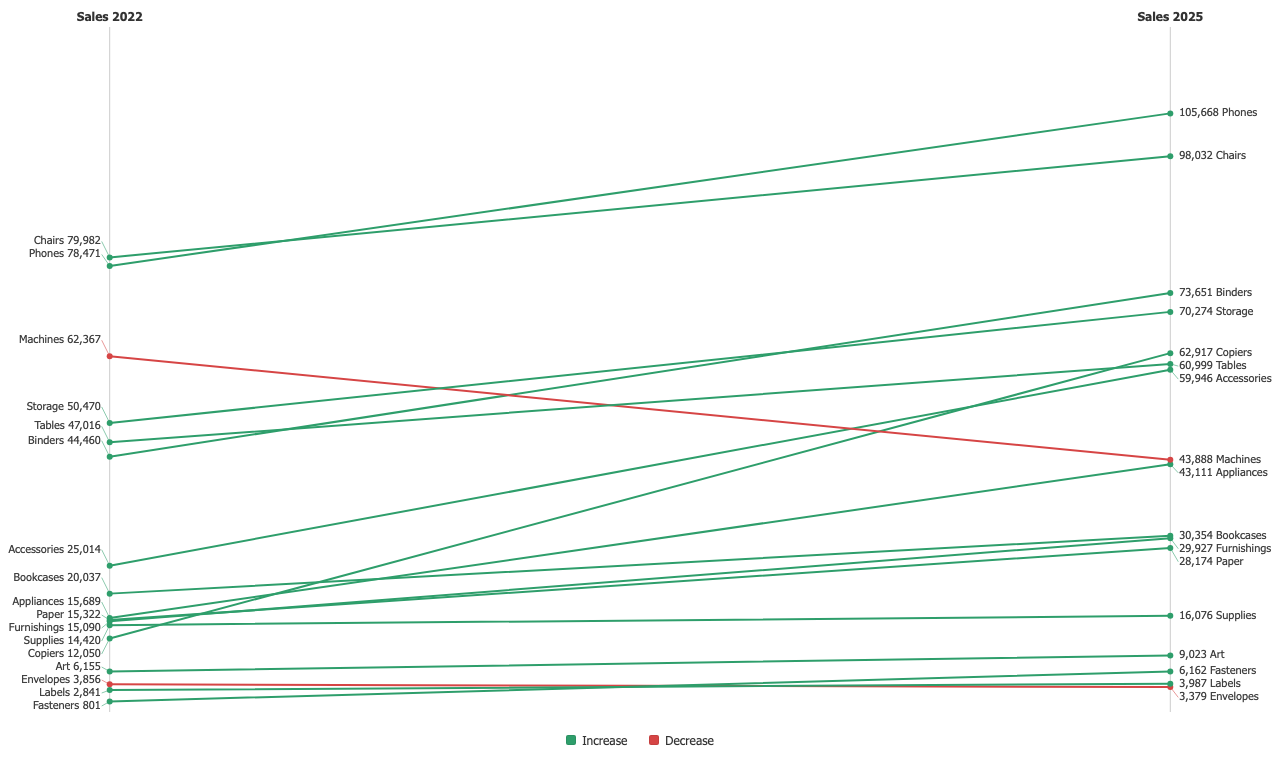
Labels that keep their line
Labels that would collide are pushed apart, and each one that moved keeps a hairline back to its own dot. A label read against the wrong line is a wrong answer that looks right, and that is the failure this removes.
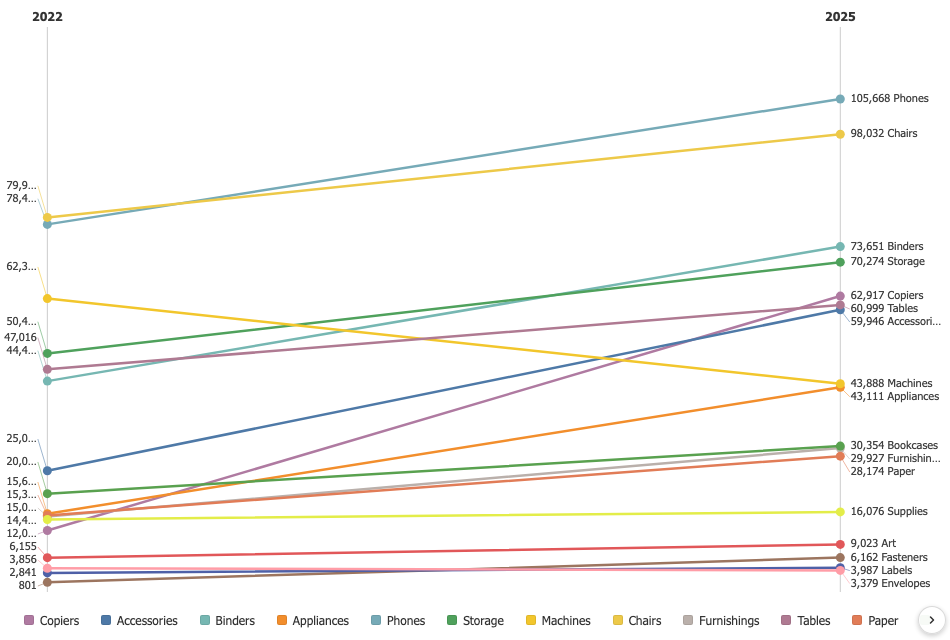
A few lines or many
Four regions with wide lines and both sides labelled, or a full catalogue where the crossings matter more than the names. When there is no room for labels at all, the chart says so instead of dropping them in silence.