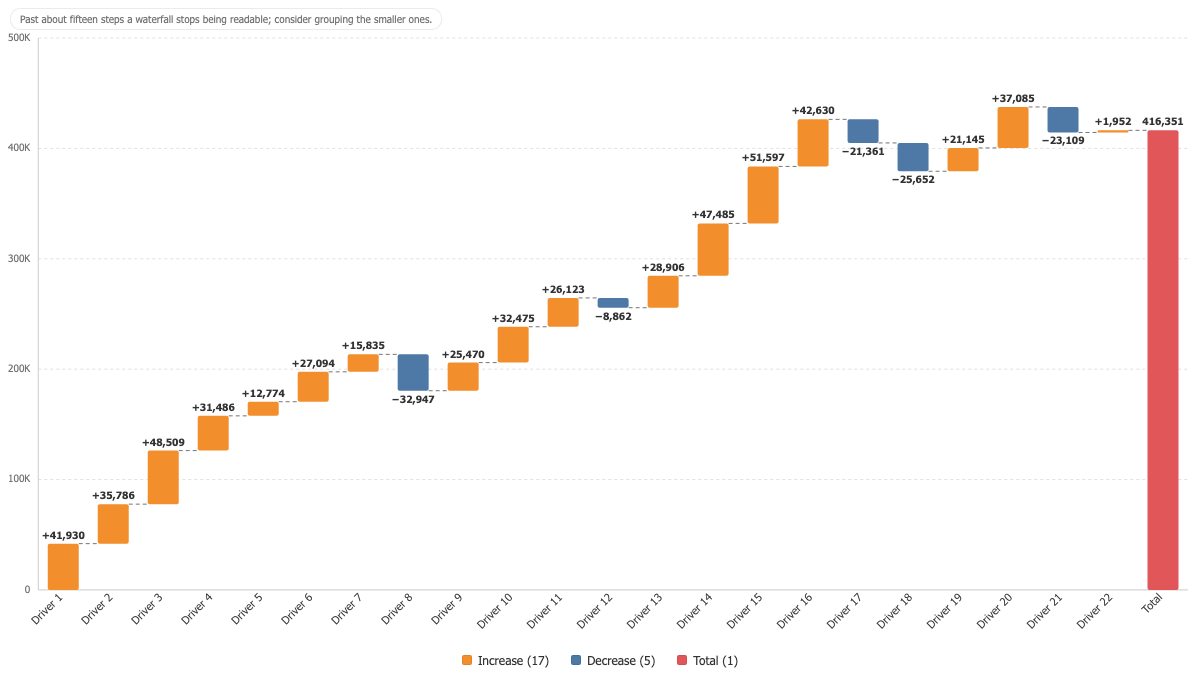
Waterfall Chart
Tableau Viz Extension
A starting value, a run of changes, an ending value, with the arithmetic on show.
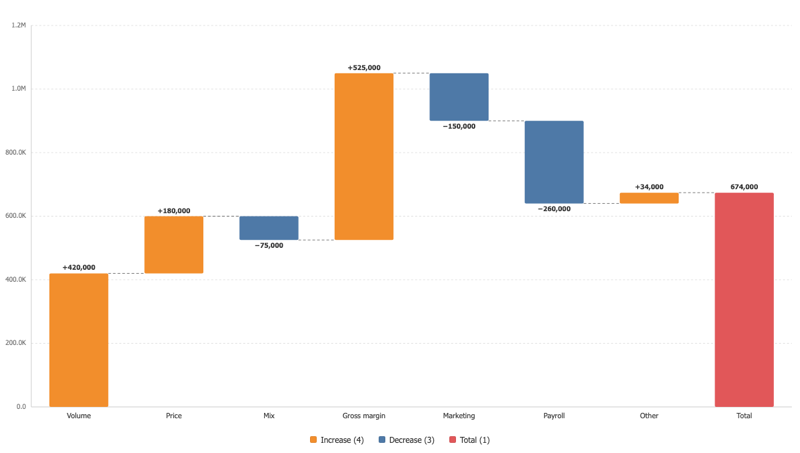
Built for a bridge
Steps stay in the order Tableau delivers them, because a waterfall is a narrative and sorting by size would tell a different one. Opening and closing bars are one click away.
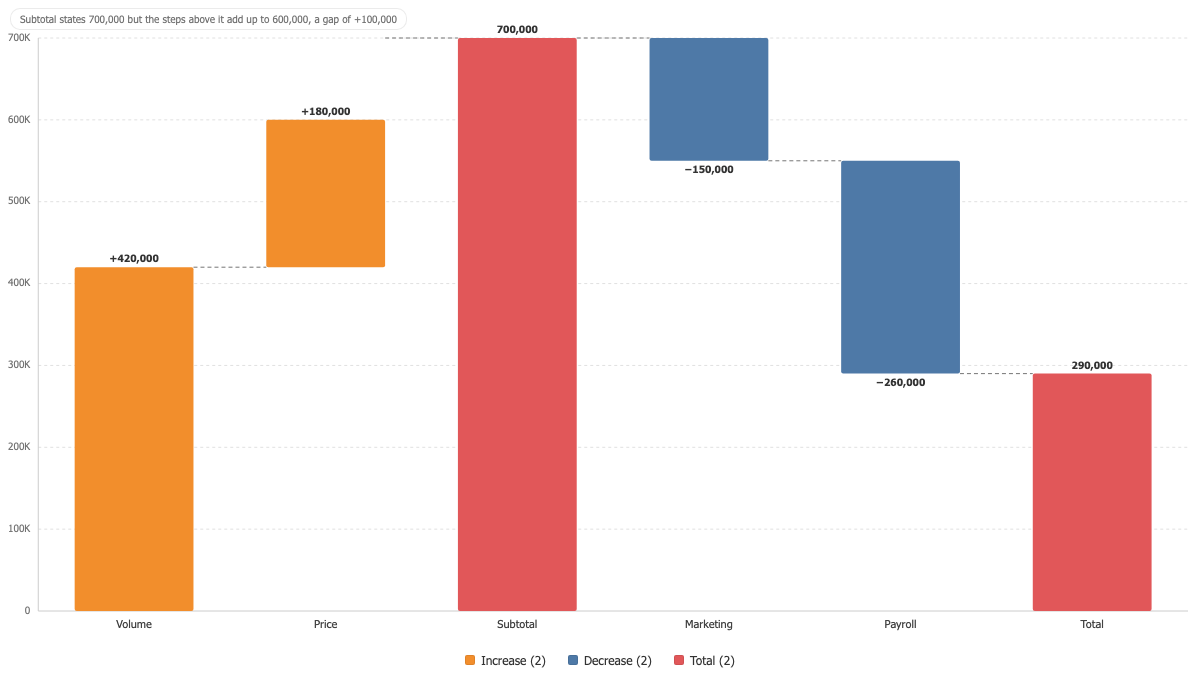
It says when the total is wrong
A checkpoint restates the running total. When the value in your data disagrees with the steps above it, the chart reports the gap rather than drawing the bar as though it agreed.
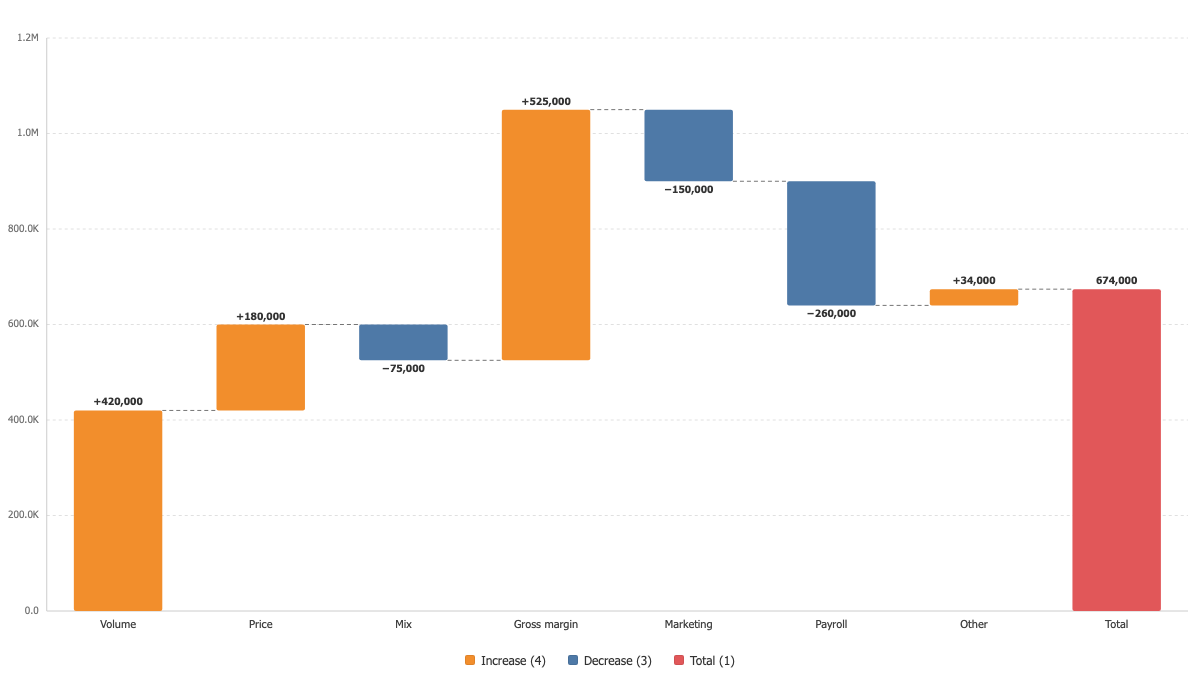
Changes or levels
Read each value as a change that adds to the running total, or as the level after each step. Both shapes of data draw the same chart.